Download

1 / 44
440 likes | 456 Views
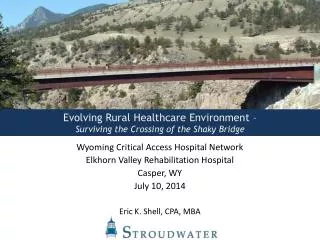
An Evolving Healthcare Environment - Crossing the Shaky Bridge Implications for Quality. South Carolina Hospital Association Ninth Annual Transforming Health Symposium – “Opening Doors” April 6-7, 2016 Columbia Metropolitan Convention Center Columbia, SC Eric K. Shell, CPA, MBA.

E N D
An Evolving Healthcare Environment - Crossing the Shaky BridgeImplications for Quality South Carolina Hospital Association Ninth Annual Transforming Health Symposium – “Opening Doors” April 6-7, 2016 Columbia Metropolitan Convention Center Columbia, SC Eric K. Shell, CPA, MBA
The Healthcare Environment Has Changed! • In the past 36 months, the healthcare field has experienced considerable changes with an increased number of rural-urban affiliations, physicians transitioning to hospital employment models, flattening volumes, CEO turnover, etc. • Federal healthcare reform passed in March 2010 with sweeping changes to healthcare systems, payment models, and insurance benefits/programs • Many of the more substantive changes will be implemented over the next two years • State Medicaid programs are moving toward managed care models or reduced fee for service payments to balance State budgets • Commercial insurers are steering patients to lower cost options • Thus, providers face new financial uncertainty and challenges and will be required to adapt to the changing market INTRODUCTION
Market Overview • High Deductible Health Plans • Non Healthcare CEO quote: • “We just renewed our High Deductible Plan going into our third year, and guess what.....5% reduction in premium!!! Needless to say everyone is thrilled. Not sure what the average HSA balance is, but I think it is high. Doing what it is supposed to do, turning health care patients into consumers.” • Underinsurance • State Budget Deficits • Recovery Audit Contractors (RAC) • Reduced Re-admissions • Accelerating shift to outpatient care • MACRA (SGR Fix) • Comprehensive Pay Model • 340B attacks • Bipartisan Budget Act of 2015 MARKETOVERVIEW TRANSITION FRAMEWORK STRATEGIES
Growth of High Deductible Plans MARKETOVERVIEW TRANSITION FRAMEWORK STRATEGIES
Reduced Readmission Rates CMS: 2,610 PPS hospitals to receive penalties in 2015 Source: Centers for Medicare and Medicaid Services, Offices of Enterprise Management MARKETOVERVIEW TRANSITION FRAMEWORK STRATEGIES
Market Overview – Results • Declining Patient Volumes Source: Kaiser State Health Facts, kff.org MARKETOVERVIEW TRANSITION FRAMEWORK STRATEGIES
SGR Fix (MACRA) – Rate Changes Summary Sources: Health Affairs, Modern Healthcare, Congressional Budget Office MARKETOVERVIEW TRANSITION FRAMEWORK STRATEGIES
SGR Fix – Implications (Source: H&HN Daily 4/6/2015) • Accelerating the replacement of Medicare¹s fee-for-service payments to physicians with risk-based alternatives • Implication: Hospital participation in patient-centered medical homes, bundled payment and accountable care organizations as partners with their physicians is a business imperative. If a hospital is not active in these pursuits, non-employed physicians might find business partners with capital, expertise and infrastructure elsewhere. • Increasing Medicare payments to physicians by 0.5 percent per year through 2019 is hardly enough to offset medical inflation, regulatory compliance requirements in the Affordable Care Act, IT costs for meaningful use and ICD-10 implementation. • These additional operating costs will require hospitals to develop more sophisticated ways to manage the medical practices they own and support independent practices with whom affiliation is necessary. That might mean deferring capital from other projects to invest in better systems and personnel to assist these practices. MARKETOVERVIEW TRANSITION FRAMEWORK STRATEGIES
Service Area Market Overview – Healthcare Reform • Coverage Expansion • By 1/1/14, expand Medicaid to all non-Medicare eligible individuals under age 65 with incomes up to 133% FPL based on modified AGI • Currently, Medicaid covers only 45% of poor (≤ 100% FPL) • 16 million new Medicaid beneficiaries; mostly “traditional” patients • FMAP for newly eligible: 100% in 2014-16; 95% in 2017; 94% in 2018; 93% in 2019; 90% in 2020+ • Establishment of State-based Health Insurance Exchanges • Subsidies for Health Insurance Coverage • Individual and Employer Mandate • Provider Implications • Insurance coverage will be extended to 32 million additional Americans by 2019 • Expansion of Medicaid is major vehicle for extending coverage • May release pent-up demand and strain system capacity • Traditionally underserved areas and populations will have increased provider competition • Have insurance, will travel! MARKETOVERVIEW TRANSITION FRAMEWORK STRATEGIES
Service Area Market Overview – Healthcare Reform • Results (Source: Gallup August 10, 2015 Survey) SC – 18.7% to 12.6% MARKETOVERVIEW TRANSITION FRAMEWORK STRATEGIES
Service Area Market Overview – Healthcare Reform • Medicare and Medicaid Payment Policies • Medicare Update Factor Reductions • Annual updates will be reduced to reflect projected gains in productivity • Medicare and Medicaid Disproportionate Share Hospital (DSH) Payment Reductions • Medicare Hospital Wage Index • Independent Payment Advisory Board (IPAB) • Charged with figuring out how to reduce Medicare spending to targets with goal of $13B savings between 2014 and 2020 • Summary Impact MARKETOVERVIEW TRANSITION FRAMEWORK STRATEGIES
Service Area Market Overview – Healthcare Reform MARKETOVERVIEW TRANSITION FRAMEWORK STRATEGIES
Service Area Market Overview – Healthcare Reform • Medicare and Medicaid Payment Policies (continued) • Provider Implications • Payment changes will increase pressure on hospital margins and increase competition for patient volume • “Do more with less and then less with less” • Medicaid pays less than other insurers and will be forced to cut payments further MARKETOVERVIEW TRANSITION FRAMEWORK STRATEGIES
Service Area Market Overview – Healthcare Reform • Medicare and Medicaid Delivery System Reforms • Expansion of Medicare and Medicaid Quality Reporting Programs • Medicare and Medicaid Healthcare-Acquired Conditions (HAC) Payment Policy • By Oct. 2014, the 25% of hospitals with the highest HAC rates will get a 1% overall payment penalty • Medicare Readmission Payment Policy • Hospitals with above expected risk-adjusted readmission rates will get reduced Medicare payments • Value based purchasing • Medicare will reduce DRG payments to create a pool of funds to pay for the VBPP • 1% reduction in FFY 2013, Grows to 2% by FFY 2017 • Bundled Payment Initiative • Accountable Care Organizations • Each ACO assigned at least 5,000 Medicare beneficiaries • Providers continue to receive usual fee-for-service payments • Compare expected and actual spend for specified time period • If meet specified quality performance standards AND reduce costs, ACO receives portion of savings MARKETOVERVIEW TRANSITION FRAMEWORK STRATEGIES
Service Area Market Overview – Healthcare Reform • Medicare and Medicaid Delivery System Reforms (continued) • Medicare Accountable Care Organizations (continued) • 154 ACOs effective August, 2012 • 287 ACOs effective January, 2013 • 391 ACOs effective January, 2014 • 426 ACOs effective January 2015 • 477 ACOs effective January 2016 • 8.9 million Medicare beneficiaries, or about 25% of total Medicare fee-for-service beneficiaries, now in Medicare ACOs • 64 ACOs are in a risk-bearing track including SSP, Pioneer ACO Model, Next Generation ACO Model , and Comprehensive ESRD Care Model Source: HHS Press Release, January 11, 2016 http://www.kaiserhealthnews.org/stories/2011/january/13/aco-accountable-care-organization-faq.aspx http://www.cms.gov/Medicare/Medicare-Fee-for-Service-Payment/sharedsavingsprogram/News.html MARKETOVERVIEW TRANSITION FRAMEWORK STRATEGIES
Where Are Medicare ACOs Forming? Source: CMS 1/20/15- Mapped from address of parent ACO MARKETOVERVIEW TRANSITION FRAMEWORK STRATEGIES
ACO Growth – 2015 and beyond MARKETOVERVIEW TRANSITION FRAMEWORK STRATEGIES
ACOs – New Regulations • ACO Investment Model (AIM) – October 15, 2014 • Goal: help rural providers offset the cost of operating a MSSP ACO • Benefits: • New MSSP candidates receive upfront fixed payment ($250K) and variable payment based on attributed beneficiary ($36/beneficiary), and monthly variable payment based on attributed beneficiary ($8) • Upfront payments will be recovered out of shared savings • Pre-payments act as forgivable loan if applicant remains in MSSP for 3 years and meets eligibility and performance requirements • Eligibility • Accepted into MSSP • Less than 10K lives • No hospital unless CAH or rural hospital > 100 beds • Competitive grant with positive points for providers willing to take downside risk • 41 Participants effective January 1, 2016 MARKETOVERVIEW TRANSITION FRAMEWORK STRATEGIES
ACOs – New Regulations • Next Generation ACO Model – March 10, 2015 • Goal: Test ACO capacity to take on near-complete financial risk in combination with a stable, predictable benchmark and payment mechanism • Design/Benefits • Prospectively-set benchmark that incorporates historical and regional costs • Future trend to incorporate regional trend, patient acuity, and quality/efficiency discount • Payment options including normal FFS payment, normal FFS plus monthly infrastructure payment, population based payment; and capitation • Choice of one of two risk sharing arrangements that determine portion of savings or losses that accrue to the ACO • Minimum of 10K attributed beneficiaries or 7.5K if deemed rural • 21 Participating ACOs effective January 1, 2016 MARKETOVERVIEW TRANSITION FRAMEWORK STRATEGIES
ACOs – New Regulations – June 4, 2015 • More time under shared savings • Added Track 3: 75% savings on risk sharing plans • New methods to identify which patients are included • Refines policies for resetting ACO benchmarks • Announces CMS’ intent to propose further improvements to benchmarking MARKETOVERVIEW
ACOs – New Regulations – January 28, 2016 • Modify process for resetting the benchmarks • Incorporate factors based on regional FFS expenditures including: • Using regional versus national trends • Adjusting subsequent rebased benchmarks using a % of difference between actual and FFS MARKETOVERVIEW TRANSITION FRAMEWORK STRATEGIES
Medicare ACO 2014 Results • In August 2015, CMS issued 2014 quality and financial performance results showing that Medicare Accountable Care Organizations (ACOs) continue to improve the quality of care for Medicare beneficiaries, while generating financial savings, suggesting that ACOs are delivering higher quality care to more and more Medicare beneficiaries each year. • According to the results • During the third performance year, Pioneer ACOs generated total model savings of $120 million, an increase of 24% from Performance Year 2 ($96 million). • Total model savings per ACO increased from $2.7 million per ACO in Performance Year 1 to $4.2 million per ACO in Performance Year 2 to $6.0 million per ACO in Performance Year 3. • The mean quality score among Pioneer ACOs increased to 87.2 percent in Performance Year 3 from 85.2 percent in Performance Year 2, which was itself an improvement from 71.8 percent in Performance Year 1. • The organizations showed improvements in 28 of 33 quality measures and experienced average improvements of 3.6% across all quality measures compared to Performance Year 2. • Ninety-two Shared Savings Program ACOs held spending $806 million below their targets and earned performance payments of more than $341 million as their share of program savings. • Shared Savings Program ACOs that reported in both 2013 and 2014 improved on 27 of 33 quality measures. Source: CMS.gov 2015 Fact Sheets MARKETOVERVIEW TRANSITION FRAMEWORK STRATEGIES
Medicare ACO Results MARKETOVERVIEW TRANSITION FRAMEWORK STRATEGIES
Fee-For-Service Financial Model Assumptions • Utilization • Inpatient and Outpatient • Impact of ACA • Impact of Blue Cross steerage initiatives • Revenue • Third party price increases • Cost based Medicare revenue • DSH payments (Zeroed out in 2014) • Bad debt % of patient service revenue (75% reduction in 2014) • Impact of ACA • Meaningful use incentive payments • Other operating revenue • Non-operating gains and • Expenses • Salaries, wages and benefits • Productivity • Supplies and other MARKET OVERVIEW TRANSITION FRAMEWORK STRATEGIES
Fee-For-Service Financial Model – Results When operating income becomes negative in 2016, cash reserves start to decline • Operational improvement and shared service economies of scale are insufficient to combat declining utilization • Can’t cut your way to sustainability MARKETOVERVIEW TRANSITION FRAMEWORK STRATEGIES
Service Area Market Overview – Healthcare Reform • Medicare and Medicaid Delivery System Reforms (continued) • Provider Implications • Hospitals are taking the lead in forming Accountable Care Organizations with physician groups that will share in Medicare savings • Value based purchasing program will shift payments from low performing hospitals to high performing hospitals • Acute care hospitals with higher than expected risk-adjusted readmission rates and HAC will receive reduced Medicare payments for every discharge • Physician payments will be modified based on performance against quality and cost indicators • There are significant opportunities for demonstration project funding MARKETOVERVIEW TRANSITION FRAMEWORK STRATEGIES
Closed Rural Hospitals Since the Beginning of 2010 Sources: >Kaiser Commission on Medicaid and the Uninsured (Medicaid Expansion) >The North Carolina Rural Health Research Program (Closures)-3/23/2016 MARKETOVERVIEW TRANSITION FRAMEWORK STRATEGIES
We Have Moved into a New Environment! • Subset of most recent challenges • Payment systems transitioning from volume based to value based • Increased emphasis as quality as payment and market differentiator • Reduced payments that are “Real this time” • New environmental challenges are the TRIPLE AIM!!! • Market Competition on economic driver of healthcare: PATIENT VALUE MARKETOVERVIEW TRANSITION FRAMEWORK STRATEGIES
Future Hospital Financial Value Equation • Definitions • Patient Value • X Population • Accountable Care: • A mechanism for providers to monetize the value derived from increasing quality and reducing costs • Accountable care includes many models including bundled payments, value-based payment program, provider self-insured health plans, Medicare defined ACO, capitated provider sponsored healthcare, etc. • Different “this time” • Providers monetize value • Government “All In” • New information systems to manage costs and quality • Agreed upon evidence-based protocols • Going back is not an option MARKETOVERVIEW TRANSITION FRAMEWORK STRATEGIES
Future Hospital Financial Value Equation • ACO Relationship to Small and Rural Hospitals • Revenue stream of future tied to Primary Care Physicians (PCP) and their patients • Small and rural hospitals bring value / negotiating power to affiliation relationships as generally PCP based • Smaller community hospitals and rural hospitals have value through alignment with revenue drivers (PCPs) rather than cost drivers but must position themselves for new market: • Alignment with PCPs in local service area • Develop a position of strength by becoming highly efficient • Demonstrate high quality through monitoring and actively pursuing quality goals MARKETOVERVIEW TRANSITION FRAMEWORK STRATEGIES
Future Hospital Financial Value Equation • Economics • As payment systems transition away from volume based payment, the current economic model of increasing volume to reduce unit costs and generate profit is no longer relevant • New economic models based on patient value must be developed by hospitals but not before the payment systems have converted • Economic Model: FFS Rev and Exp VS. Budget Based Payment Rev and Exp MARKETOVERVIEW TRANSITION FRAMEWORK STRATEGIES
The Challenge: Crossing the Shaky Bridge Fee for Service Payment System Population Based Payment System 2012 2013 2014 2015 2016 MARKET OVERVIEW TRANSITION FRAMEWORK STRATEGIES
The Premise • Provider Imperatives • F-F-S • Management of price, utilization, and costs • PBPS • Management of care for defined population • Providers assume insurance risk • Macro-economic Payment System • Government Payers • Changing from F-F-S to PBPS • Private Payers • Follow Government payers • Steerage to lower cost providers • Provider organization • Evolution from • Independent organizations competing with each other for market share based on volume to • Aligned organizations competing with other aligned organizations for covered lives based on quality and value • Network and care management organization • New competencies required • Network development • Care management • Risk contracting • Risk management MARKET OVERVIEW TRANSITION FRAMEWORK STRATEGIES
Implementation Framework – What Is It? MARKET OVERVIEW TRANSITION FRAMEWORK STRATEGIES
Initiative I – Operating Efficiencies, Patient Safety and Quality • Hospitals not operating at efficient levels are currently, or will be, struggling financially • “Efficient” is defined as • Appropriate patient volumes meeting needs of their service area • Revenue cycle practices operating with best practice processes • Expenses managed aggressively • Physician practices managed effectively • Effective organizational design Graphic: National Patient Safety Foundation MARKET OVERVIEW TRANSITION FRAMEWORK STRATEGIES
Initiative I – Operating Efficiencies, Patient Safety and Quality • Focus on Quality and Patient Safety • As a strategic imperative • As a competitive advantage MARKET OVERVIEW TRANSITION FRAMEWORK STRATEGIES
Initiative II – Primary Care Alignment • Understand that revenue streams of the future will be tied to primary care physicians, which often comprise a majority of the rural and small hospital healthcare delivery network • Thus small and rural hospitals, through alignment with PCPs, will have extraordinary value relative to costs • Physician Relationships • Hospital align with employed and independent providers to enable interdependence with medical staff and support clinical integration efforts • Contract (e.g., employ, management agreements) • Functional (share medical records, joint development of evidence based protocols) • Governance (Board, executive leadership, planning committees, etc.) • Potential Model for Rural: • New PHO MARKET OVERVIEW TRANSITION FRAMEWORK STRATEGIES
Initiative III – Rationalize Service Network • Develop system integration strategy • Evaluate wide range of affiliation options ranging from network relationships, to interdependence models, to full asset ownership models • Interdependence models through alignment on contractual, functional, and governance levels, may be option for rural hospitals that want to remain “independent” • Explore / Seek to establish interdependent relationships among small and rural hospitals understanding their unique value relative to future revenue streams • Identify the number of providers needed in the service area based on population and the impact of an integrated regional healthcare system • Conduct focused analysis of procedures leaving the market • Understand real value to hospitals • Under F-F-S • Under PBPS (Cost of out of network claims) MARKET OVERVIEW TRANSITION FRAMEWORK STRATEGIES
Payment System Strategy – Initiative I • Develop self-funded employer health plan • Hospital is already 100% at risk for medical claims thus no risk for improving health of employee “population” • Change benefits to encourage greater “consumerism” • Differential premium for elective “risky” behavior • “Enroll” employee population in health programs – health coaches, chronic disease programs, etc. • FFS Quality and Utilization Incentives • Maximize FFS incentives for improving quality or reducing inappropriate utilization (e.g., inappropriate ER visits, re-admissions, etc.) MARKET OVERVIEW TRANSITION FRAMEWORK STRATEGIES
Payment System Strategy – Initiatives II and III • Initiative II: Implementation planning for transitional payment models • Transitional payment models include: • FFS against capitation benchmark w/ shared savings • Shared savings model Medicare ACOs • Shared savings models with other governmental and commercial insurers • Partial capitation and sub-capitation options with shared savings • Prioritize insurance market opportunities • Take the initiative with insurers to gauge interest and opportunities for collaborating on transitional payment models • Explore direct contracting opportunities with self-funded employers • Initiative III: Develop strategy for full risk capitated plans MARKET OVERVIEW TRANSITION FRAMEWORK STRATEGIES
Population Health Strategies – Phase I • Phase I: Develop Population Health building blocks • Goal: Infrastructure to manage self insured lives and maximize FFS Utilization and quality incentives • Initiatives: • PCMH or like structure • Care management • Discharge planning across the continuum • Transportation, PCP, meds, home support, etc. • Transitions of care (checking in on treatment plan) • Medication reconciliation • Post discharge follow-up calls (instructions, teach back, medication check-in) • Identifying community resources • Maintain patient contact for 30 days • Develop claims analysis capabilities/infrastructure • Develop evidenced based protocols MARKET OVERVIEW TRANSITION FRAMEWORK STRATEGIES
Implementation Framework – In Review MARKET OVERVIEW TRANSITION FRAMEWORK STRATEGIES
Conclusions/Recommendations • For decades, rural hospitals have dealt with many challenges including low volumes, declining populations, difficulties with provider recruitment, limited capital constraining necessary investments, etc. • The current environment driven by healthcare reform and market realities now offers a new set of challenges. Many rural healthcare providers have not yet considered either the magnitude of the changes or the required strategies to appropriately address the changes • Core set of new challenges represents the Triple Aim being played on in the market • Locally delivered healthcare (including rural and small community hospitals) has high value in the emerging delivery system • “Shaky Bridge” crossing will required planned, proactive approach • Finance will lead function and form • Maintain alignment between delivery system models and payment systems building flexibility into the delivery system model for the changing payment system CONCLUSIONS / RECOMMENDATIONS
Conclusions/Recommendations (continued) • Important strategies for providers to consider include: • Increase leadership awareness of new environment realities • Strategic plan to be updated to incorporate new strategic imperatives – “Bridge Strategy” • Improve operational efficiency of provider organizations • Adapt effective quality measurement and improvement systems as a strategic priority • Align/partner with medical staff members contractually, functionally, and through governance where appropriate • Seek interdependent relationships with developing regional systems CONCLUSIONS / RECOMMENDATIONS