Download
1 / 8
80 likes | 107 Views
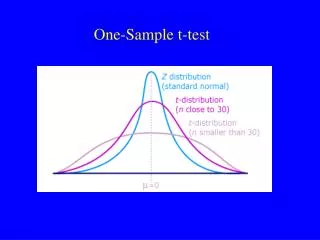
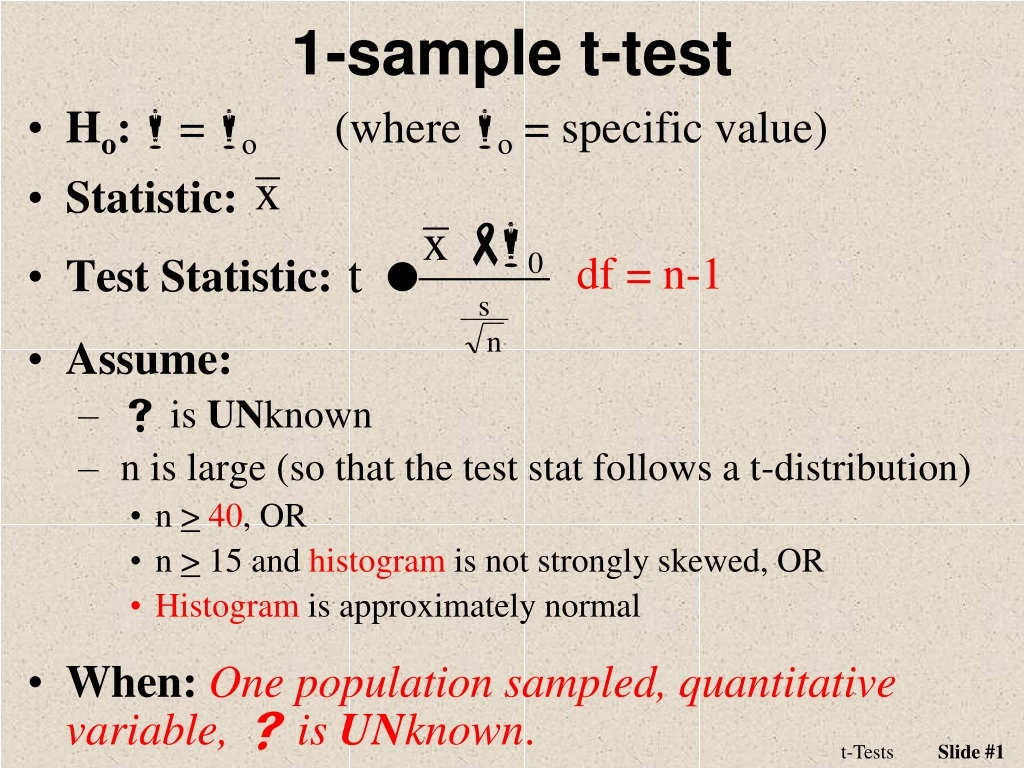
1-sample t-test. H o : m = m o (where m o = specific value) Statistic: Test Statistic: Assume : s is UN known n is large (so that the test stat follows a t-distribution) n > 40 , OR n > 15 and histogram is not strongly skewed, OR Histogram is approximately normal

E N D
1-sample t-test • Ho:m = mo (where mo = specific value) • Statistic: • Test Statistic: • Assume: • s is UNknown • n is large (so that the test stat follows a t-distribution) • n >40, OR • n > 15 and histogram is not strongly skewed, OR • Histogram is approximately normal • When:One population sampled, quantitative variable, sis UNknown. df = n-1 t-Tests
A Full Example • In Health magazine reported (March/April 1990) that the average saturated fat in one pound packages of butter was 66%. A food company wants to determine if its brand is significantly less than this overall mean. They analyzed a random sample of 96 one pound packages of its butter. Test the company’s hypothesis at the 1% level. Variable n Mean St. Dev. Min ... %SatFat 96 65.6 1.41 60.2 ... t-Tests
Recipe for any Hypothesis Test 1) State the rejection criterion (a) a=0.01 2) State the null &alternative hypotheses, define the parameter(s) Ho: m = 66 Ha: m < 66 …. m is mean %SatFat for all 1-lb package of butter from this company 3) Determine which test to perform – Explain! 1-sample t-test … because (a) a single population (1-lb packages of butter from this company), (b) quantitative variable (%SatFat), and (c) s is unknown. Inference Concepts
Recipe for any Hypothesis Test 4) Collect the data (address type of study and randomization) (i) Observational study (no control imparted on packages of butter) (ii) A random sample (n=96) was taken 5) Check all necessary assumption(s) (i) s is unknown (ii) n=96>40 6) Calculate the appropriate statistic(s) `x = 65.6 (in background) Inference Concepts
Recipe for any Hypothesis Test 7) Calculate the appropriate test statistic df = 96-1 = 95 8) Calculate the p-value • > ( distrib(-2.78,distrib="t",df=95) ) • [1] 0.003276885 Inference Concepts
Recipe for any Hypothesis Test 9) State your rejection decision p-value (0.0033) < a (0.01) …. Reject Ho 10) Summarize your findings in terms of the problem The mean percent saturated fat for all 1-lb packages of butter for this company appears to be less than that (=66) for the industry as a whole. Inference Concepts
Recipe for any Hypothesis Test 11) If rejected H0, compute a 100(1-a)%confidence region for parameter (i) 100(1-0.01)% = 99% (ii) Upper bound … because Ha was less than (iii) t* = +2.366 … from distrib(0.99,distrib=“t”,df=95,type=“q”) (iv) 65.6 +2.366*0.144 65.6 + 0.34 65.94 (v) I am 99% confident that the mean percent saturated fat for all 1-lb packages of butter from this company is less than 65.94. Inference Concepts
Practical Significance • Is there a real difference between 66% and 65.6% saturated fat? • If the sample size is large enough, any hypothesis can be rejected. t-Tests