Download
1 / 47
470 likes | 618 Views
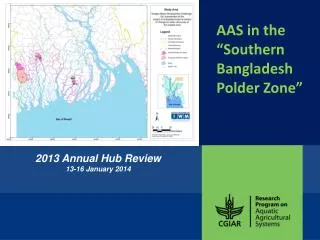
2013 Annual Ocean Review. Prepared by Climate Prediction Center , NCEP/NOAA February 7, 2014. http://www.cpc.ncep.noaa.gov/products/GODAS/ This project to deliver real-time ocean monitoring products is implemented by CPC in cooperation with NOAA Ocean Climate Observation Program (OCO).

E N D
2013 Annual Ocean Review Prepared by Climate Prediction Center, NCEP/NOAA February 7, 2014 http://www.cpc.ncep.noaa.gov/products/GODAS/ This project to deliver real-time ocean monitoring products is implemented by CPC in cooperation with NOAA Ocean Climate Observation Program (OCO)
Global SST Anomaly in 2013 • The 2013 SST anomaly (SSTA) was characterized by positive SSTA in the central North Pacific, Indo-Pacific warm pool (IPWP), North Atlantic and negative SSTA in the eastern equatorial Pacific (EPAC). • The positive SSTA over IPWP exceeding +1 STD persisted throughout 2013. Negative SSTA exceeding -1 STD emerged in EPAC during summer and persisted into fall 2013. Based upon the NINO3.4 index, the tropical Pacific was in ENSO-neutral conditions in 2013. • The North Pacific SSTA was characterized by a negative phase of PDO which has persisted from May 2010 to present (3.7 years). • The positive SSTA over IPWP has persisted since 2000 favoring persistent La Nina-like atmospheric circulations.
Historical Perspective of 2013 SST Anomaly • The mean SST in the tropical Pacific changed little from 2012 to 2013, ranking the 14th warmest year since 1982. • The mean SST in the tropical Indian Ocean changed little from 2012 to 2013, ranking the 7th warmest year since 1982. • The mean SST in the tropical Atlantic warmed up by 0.13oC in 2013, becoming the 13th warmest year since 1982. • Themean SST in the North Atlantic decreased substantially (-0.21oC) from the 2012 historical high, becoming the 8th warmest year since 1982. • The mean SST in the North Pacific increased substantially (+0.28oC), becoming the warmest year since 1982. • The global ocean SST warmed by about +0.03oC, becoming the 3rd warmest year since 1982.
2013 Yearly Mean SST Anomaly and Tendency • Negative PDO pattern • Overall warm ocean with positive SSTA over Indo-Pacific warm pool, in the eastern Indian Ocean, southwest Pacific, N. Atlantic and along the east coast of N. America • Negative SSTA in the southeastern tropical Pacific • Warming tendency extending from south of Bering Strait to Gulf of Alaska to northeast Pacific • Warming tendency over Indo-Pacific warm pool • Warming in the tropical Atlantic • Cooling in the southeast Pacific Fig. 3.1. (a) Yearly mean OISST anomaly (°C, relative to 1981-2010 average) in 2013, (b) 2013 minus 2012 OISST anomaly. The box shows the area in which the normalized average SSTA is shown in Fig. 3.3a,b. From Xue et al. (2014) to appear in the BAMS State of the Climate in 2013
In 2013 the OLR anomaly pattern, indicating enhanced (suppressed) convection over Indonesia (near Dateline), was associated with the west-east SSTA gradient. • In 2013, the northward shift of ITCZ in the eastern Pacific was probably associated with the south-north SSTA gradient. • The 2013 minus 2012 OLR anomaly has a dipole pattern in the tropical Indian Ocean, which seems related to the warming in the eastern Indian Ocean.
In 2013 the easterly wind anomaly between 120E-180E corresponds well with the 2013 OLR anomaly pattern. • In 2013 the cross-equatorial wind anomaly in the eastern Pacific corresponds well with the northward shift of ITCZ.
The positive SSTA in the N. Pacific and the negative PDO pattern is consistent with easterly wind anomalies in central N. Pacific and anomalous anti-cyclonic circulations near Gulf of Alaska. • The positive 2013-2012 SSTA difference near Gulf of Alaska is consistent with the anti-cyclonic wind anomaly. • The positive 2013-2012 SSTA difference in the northeast subtropical Pacific is consistent with the westerly wind anomaly.
Linear Trend in 1993-2008 (Xue et al. 2011, Clim. Dyn.) GODAS HC300 OI SST • The negative PDO pattern in SSTA corresponds well with the negative PDO pattern in HC300 anomaly (HC300A). • Both positive SSTA and HC300A extended from the central N. Pacific to the western tropical Pacific, and then to the eastern Indian Ocean and western South Pacific near Australia. • Negative HC300A dominated in the subtropical and extra-tropical eastern Pacific. • The HC300A pattern is partially attributed to the linear trend.
AVISO SSH Linear Trend (Xue et al. 2011, Clim. Dyn.) GODAS HC300 • The negative PDO pattern in HC300A corresponds well with the negative PDO pattern in SSH anomaly (SSHA). • Both positive HC300A and SSHA extended from the central N. Pacific to the western tropical Pacific, and then to the eastern Indian Ocean and western South Pacific near Australia. • HC300 was below-normal in the subtropical and extra-tropical eastern Pacific, while SSH was near-normal in the eastern Pacific. • The SSHA pattern is partially attributed to the linear trend. • The HC300A tendency is consistent with the SSHA tendency, indicating warming off the equator in the central-eastern Pacific.
Seasonal Mean SST Anomaly in 2013 MAM DJF Fig. 3.2. Seasonal mean SSTA from OISST (shading, oC, relative to 1981-2010 average) for (a) December 2012 to February 2013, (b) March to May 2013, (c) June to August 2013 and (d) September to November 2013. The contours are +1 and -1 normalized seasonal mean SSTA based on seasonal mean standard deviation over 1981-2010. From Xue et al. (2014) to appear in the BAMS State of the Climate in 2013 JJA SON • The winter 2012/2013 (December-February) was characterized by a negative PDO pattern in the North Pacific, and ENSO-neutral conditions in the tropical Pacific. Both ENSO-neutral and negative PDO conditions persisted throughout 2013. • The positive SSTA over Indo-Pacific warm pool exceeding +1 STD persisted throughout 2013. Negative SSTA of more than -1 STD emerged in the eastern Pacific during summer and persisted into fall 2013.
Fig. 3.3. (a) Monthly normalized average SSTA over Indo-Pacific warm pool in the box shown in Fig. 3.1, labeled as WSSTA (bar) and monthly normalized NINO3.4 index (average SSTA in 170oW-120oW, 5oS-5oN) (line) in 2010-2013 and; (b) 5-month running mean of SSTA indices in 1982-2013 From Xue et al. (2014) to appear in the BAMS State of the Climate in 2013 • WSSTA exceeded +1 STD during most of 2013 and 2010. • The time series since 1982 shows that WSSTA (shading) was mostly negative before 1999 and positive after 1999, which is related to a multidecadal shift that happened around 1999 (Lyon et al. 2013). • WSSTA is generally out-of-phase with NINO3.4 with a correlation -0.45 in 1982-2013, but a correlation -0.53 before 1999 and -0.31 after 1999. • The weakened out-of-phase relationship between WSSTA and NINO3.4 after 1999 is probably related to the weakened ENSO variability after 1999 (Hu et al. 2013). • The persistent positive WSSTA after 1999 favors persistent La Nina-like atmospheric circulations with enhanced convections over Indonesia and suppressed convections near the dateline.
Seasonal Mean SST Anomaly Seasonal Mean OLR Anomaly • Positive (negative) SSTA has persisted in the western (eastern) tropical Pacific. • Consistent with the west-east SSTA gradient, convection has been persistently enhanced (suppressed) over Indonesia (near Dateline) through out the year.
Seasonal Mean OLR Anomaly Seasonal Mean 850mb Wind Anomaly • Consistent with the enhanced (suppressed) convection over Indonesia (near Dateline), easterly wind anomalies dominated in the western tropical Pacific through out the year. • Cross-equatorial wind anomaly, consistent with the northward shift of ITCZ, also persisted through out the year.
L L N N • Easterly wind anomalies persisted in the central Pacific during ENSO-neutral year of 2012 and 2013, resembling those during La Nina year of 2010 and 2011. • Convection was enhanced (suppressed) in the western Pacific (near Dateline) during ENSO-neutral 2012 and 2013, resembling those during La Nina 2010 and 2011.
Seasonal Mean 850mb Wind Anomaly Seasonal Mean Depth of 20C Anomaly • Easterly wind anomalies were consistent with the above-normal (below-normal) depth of 20C (D20) in the western (eastern) Pacific during DJF 2012/13. • Positive D20 anomaly (D20A) persisted in the western Pacific, while negative D20A appeared in off-equatorial eastern Pacific in MAM 2013. • Positive D20A propagated to the eastern Pacific due to weakening of easterly wind anomalies in JJA 2013. • Positive D20A strengthened across the equatorial belt in SON 2013. Seasonal Mean Eq. Temp. Anomaly
http://iri.columbia.edu/climate/ENSO/currentinfo/SST_table.htmlhttp://iri.columbia.edu/climate/ENSO/currentinfo/SST_table.html • Some dynamical models, i.e. CFS, JMA, FRCGC, GMAO, ESSIC, forecast the ENSO-neutral 2012/13 winter very well. • Some dynamical models, i.e. ECMWF, MetFRANCE, have weak warm biases. • Some dynamical models, i.e. LDEO, UKMO, AUS, have weak cold biases.
http://iri.columbia.edu/climate/ENSO/currentinfo/SST_table.htmlhttp://iri.columbia.edu/climate/ENSO/currentinfo/SST_table.html • Some statistical models, i.e. CPC CA, UBC NNET, and FSU REGR, forecast the ENSO-neutral 2012/13 winter very well. • Some statistical models, i.e. CPC CAC, CPC MARKOV, CDC LIM, CSU CLIPR, have weak cold biases.
The North America Multi-Model Ensemble (NMME) http://www.cpc.ncep.noaa.gov/products/NMME/ • All models from NMME forecast the ENSO-neutral 2012/13 winter well.
The Latest ENSO Forecasts • All statistical models except FSU REGR indicate ENSO-neutral conditions will continue into summer 2014. • Some dynamical models, i.e. CFS, NASA, GFDL, CMC1, CMC2, NCAR, indicate weak El Nino conditions will emerge in summer 2014.
Pacific Decadal Oscillation • Negative PDO phase has persisted from May 2010 to Jan 2014, lasting for 45 months now. • Negative (positive) PDO phase was prevalent during 1950-1975 and 1999-2012 (1976-1998). • Pacific Decadal Oscillation is defined as the 1st EOF of monthly ERSST v3b in the North Pacific for the period 1900-1993. PDO index is the standardized projection of the monthly SST anomalies onto the 1st EOF pattern. • The PDO index differs slightly from that of JISAO, which uses a blend of UKMET and OIv1 and OIv2 SST.
PDO and NINO3.4 Fig. 3.3. (c) monthly normalized PDO index (bar) and NINO3.4 index (line) in 2010-2013; (d) 5-month running mean of PDO and NINO3.4 index in 1982-2013. SSTA is relative to 1981-2010 average. From Xue et al. (2014) to appear in the BAMS State of the Climate in 2013 • There was a regime shift of PDO around 1999. After 1999 negative PDO was more frequent than the positive PDO, while before 1999 positive PDO was more frequent. During the positive phase of the PDO, PDO either lagged NINO3.4 (1983-84, 1993-1994) or was in phase with NINO3.4 (1986-87, 1997-98). The correlation between monthly PDO and NINO3.4 at zero lag is 0.3 in 1982-1998 and 0.56 in 1999-2013. The higher correlation since 1999 is partly attributed to the fact that both PDO and NINO3.4 were in prevalent negative phase since 1999. • PDO was less than -1 standard deviation in 2013 although NINO3.4 was zero.
NorthAmerica Western Coastal Upwelling • Downwelling in mid-high latitudes was suppressed during winter of 2006 (El Nino winter), 2007-2008 , 2010-2011 (La Nina winters), 2012-2013 (ENSO-neutral winters). Fig. NP2. Total (top) and anomalous (bottom) upwelling indices at the 15 standard locations for the western coast of North America. Upwelling indices are derived from the vertical velocity of the NCEP's global ocean data assimilation system, and are calculated as integrated vertical volume transport at 50 meter depth from each location to its nearest coast point (m3/s/100m coastline). Anomalies are departures from the 1981-2010 base period pentad means. • Area below (above) black line indicates climatological upwelling (downwelling) season. • Climatologically upwelling season progresses from March to July along the west coast of North America from 36ºN to 57ºN.
- CFSv2 has forecast the negative PDO phase in 2013 up to 9 month lead time.
2013 Atlantic Hurricane Season (ACE=35%, Below-normal season with the fewest number of hurricanes since 1982) • Factors influencing 2013 seasonal hurricane outlooks: • The multi-decadal signal since 1995 –Yes, but West African monsoon not enhanced • Above-average SST in tropical Atlantic and Caribbean Sea, and warmer than global tropics - Yes • ENSO-neutral conditions – Yes, but with east-west dipole SSTA • See details in http://www.cpc.ncep.noaa.gov/products/GODAS/ocean_briefing_gif/global_ocean_monitoring_2014_01.ppt
2012 Atlantic Hurricane Season (ACE=139%, Above-normal season, tied with the third-largest number of named storms (19) • Factors influencing 2012 seasonal hurricane outlooks: • The multi-decadal signal since 1995 – Yes • Above-average SST in tropical Atlantic and Caribbean Sea, and warmer than global tropics - Yes • ENSO-neutral conditions – Yes but with above-average SST in central equatorial Pacific.
Yearly Mean SST Anomaly Indices • The mean SST in the tropical Pacific changed little from 2012 to 2013, ranking the 14th warmest year since 1982. • The mean SST in the tropical Indian Ocean changed little from 2012 to 2013, ranking the 7th warmest year since 1982. • The mean SST in the tropical Atlantic warmed up by 0.13oC in 2013, becoming the 13th warmest year since 1982. • Themean SST in the North Atlantic decreased substantially (-0.21oC) from the 2012 historical high, becoming the 8th warmest year since 1982. • The mean SST in the North Pacific increased substantially (+0.28oC), becoming the warmest year since 1982. • The global ocean SST warmed by about +0.03oC, becoming the 3rd warmest year since 1982. Fig. 3.4. Yearly mean SSTA (oC, relative to 1981-2010 average) from ERSST (bar) and HadISST (blue line) for 1950-2013 (bar) and OISST for 1982-2013 (black line) averaged over the (a) tropical Pacific, (b) tropical Indian Ocean, (c) tropical Atlantic, (d) North Pacific, (e) North Atlantic, and (f) global ocean. From Xue et al. (2014) to appear in the BAMS State of the Climate in 2013
Global SST Anomaly (0C) and Anomaly Tendency • SST was above-normal (below-normal) in the western (central-eastern) tropical Pacific. • A negative PDO pattern in the N. Pacific. • A north-south dipole of SSTA presented in the N. Atlantic. • A cooling (warming) tendency presented in the western (eastern) N. Pacific. • A cooling tendency was observed in the central-eastern equatorial Pacific. • A north-south dipole of SSTA tendency presented in the N. Atlantic. Fig. G1. Sea surface temperature anomalies (top) and anomaly tendency (bottom). Data are derived from the NCEP OI SST analysis, and anomalies are departures from the 1981-2010 base period means.
Longitude-Depth Temperature Anomaly and Anomaly Tendency in 2OS-2ON Fig. G3. Equatorial depth-longitude section of ocean temperature anomalies (top) and anomaly tendency (bottom). Data are derived from the NCEP's global ocean data assimilation system which assimilates oceanic observations into an oceanic GCM. Anomalies are departures from the 1981-2010 base period means. • Positive (negative) temperature anomalies dominated in the western (central) equatorial Pacific. • Positive temperature anomalies dominated at the upper 100m of equatorial Indian Ocean. • A cooling (warming) tendency was observed in the western (central-eastern) Pacific near the thermocline, largely due to propagation of downwelling and upwelling oceanic Kelvin waves (slide 37).
Last Three Month SST, OLR and 925hp Wind Anom. • The positive SSTA in the western tropical Pacific persisted, while negative SSTA emerged in the central-eastern Pacific. • Strong westerly wind anomalies developed in the western tropical Pacific in Jan 2014.
Equatorial Pacific SST (ºC), HC300 (ºC), u850 (m/s) and OLR(W/m2 )Anomalies - Ocean heat content anomaly decreased (increased) in the eastern (western) equatorial Pacific following the passage of upwelling oceanic Kelvin waves. • Easterly wind anomalies dominated in the western equatorial Pacific in Nov-Dec, which probably forced the upwelling oceanic Kelvin waves. • Westerly wind anomalies emerged in the far western eq. Pacific in Jan, which would likely force downwelling oceanic Kelvin waves that will propagate across the eq. Pacific in next 2 months. • Positive SSTA more than +1oC persisted near 170E, while negative SSTA confined east of 110W. • Positive HC300 anomalies propagated eastward and reached 110W, due to downwelling oceanic Kelvin waves. • Easterly wind anomalies emerged in the far western equatorial Pacific in early Nov 2012 associated with Fig. P4. Time-longitude section of anomalous pentad sea surface temperature (left), upper 300m temperature average (heat content, middle-left), 850-mb zonal wind (U850, middle-right) averaged in 2OS-2ON and Outgoing Long-wave Radiation (OLR, right) averaged in 5OS-5ON. SST is derived from the NCEP OI SST, heat content from the NCEP's global ocean data assimilation system, U850 from the NCEP CDAS. Anomalies for SST, heat content and U850/OLR are departures from the 1981-2010 base period pentad means respectively.
Pacific Decadal Oscillation Index • Negative PDO phase since May 2010 has persisted for 45 months now, and the PDO index weakened slightly with PDO index = -1.0 • PDO has been in prevalent negative phase since 1999. • Pacific Decadal Oscillation is defined as the 1st EOF of monthly ERSST v3b in the North Pacific for the period 1900-1993. PDO index is the standardized projection of the monthly SST anomalies onto the 1st EOF pattern. • The PDO index differs slightly from that of JISAO, which uses a blend of UKMET and OIv1 and OIv2 SST.
Last Three Month SST, SLP and 925hp Wind Anom. • Positive SSTA in the western N. Pacific shifted eastward slightly and reached +4oC in Jan. 2014. • Anomalous anti-cyclone was observed near the coast of Pacific Northwest, favoring for upwelling.
NorthAmerica Western Coastal Upwelling • Downwelling in mid-high latitudes has been persistently suppressed since Oct 2013. Fig. NP2. Total (top) and anomalous (bottom) upwelling indices at the 15 standard locations for the western coast of North America. Upwelling indices are derived from the vertical velocity of the NCEP's global ocean data assimilation system, and are calculated as integrated vertical volume transport at 50 meter depth from each location to its nearest coast point (m3/s/100m coastline). Anomalies are departures from the 1981-2010 base period pentad means. • Area below (above) black line indicates climatological upwelling (downwelling) season. • Climatologically upwelling season progresses from March to July along the west coast of North America from 36ºN to 57ºN.
IRI/CPC NINO3.4 Forecast Plume • Most of the models predicted ENSO-neutral to continue into the Northern Hemisphere spring, but some models suggest El Nino will emerge during summer. • The consensus forecast favors ENSO-neutral conditions in spring, and the probability for ENSO-neutral and El Nino is equal in summer.
NCEP CFSv2 NINO3.4 Forecast - Latest CFSv2 prediction suggests El Nino conditions will emerge in summer 2014.
NCEP CFSv2 Pacific Decadal Oscillation (PDO) Forecast PDO is the first EOF of monthly ERSSTv3b anomaly in the region of [110oE-100oW, 20oN-60oN]. CFS PDO index is the standardized projection of CFS SST forecast anomalies onto the PDO EOF pattern. - Latest CFSv2 prediction suggests weak negative PDO phase will be likely in the coming spring and summer.
Switch to 1981-2010 Climatology • SST from 1971-2000 to 1981-2010 • Weekly OISST.v2, monthly ERSST.3b • Atmospheric fields from 1979-1995 to 1981-2010 • NCEP CDAS winds, sea level pressure, 200mb velocity potential, surface shortwave and longwave radiation, surface latent and sensible fluxes, relative humidity • Outgoing Long-wave Radiation • Oceanic fields from 1982-2004 to 1981-2010 • GODAS temperature, heat content, depth of 20oC, sea surface height, mixed layer depth, tropical cyclone heat potential, surface currents, upwelling • Satellite data climatology 1993-2005 unchanged • Aviso Altimetry Sea Surface Height • Ocean Surface Current Analyses – Realtime (OSCAR)
Be aware that new climatology (1981-2010) was applied since Jan 2011 1971-2000 SST Climatology (Xue et al. 2003): http://www.cpc.ncep.noaa.gov/products/predictions/30day/SSTs/sst_clim.htm 1981-2010 SST Climatology: http://origin.cpc.ncep.noaa.gov/products/people/yxue/sstclim/ • The seasonal mean SST in February-April (FMA) increased by more than 0.2oC over much of the Tropical Oceans and N. Atlantic, but decreased by more than 0.2oC in high-latitude N. Pacific, Gulf of Mexico and along the east coast of U.S. • Compared to FMA, the seasonal mean SST in August-October (ASO) has a stronger warming in the tropical N. Atlantic, N. Pacific and Arctic Ocean, and a weaker cooling in Gulf of Mexico and along the east coast of U.S.
Data Sources and References Please send your comments and suggestions to Yan.Xue@noaa.gov. Thanks! • Optimal Interpolation SST (OI SST) version 2 (Reynolds et al. 2002) • NCEP CDAS winds, surface radiation and heat fluxes • NESDIS Outgoing Long-wave Radiation • NDBC TAO data (http://tao.noaa.gov) • PMEL TAO equatorial temperature analysis • NCEP’s Global Ocean Data Assimilation System temperature, heat content, currents (Behringer and Xue 2004) • Aviso Altimetry Sea Surface Height • Ocean Surface Current Analyses – Realtime (OSCAR)