Download
1 / 18
180 likes | 406 Views
What lies beneath the surface: Exploring our fisheries in depth. The sea, once it casts its spell, holds one in its net of wonder forever. Jacques Yves Cousteau . Warm-up. Based on your research last night -

E N D
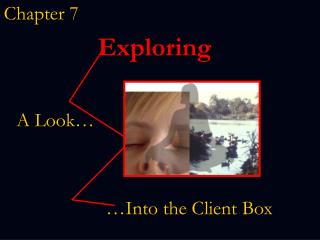
What lies beneath the surface: Exploring our fisheries in depth The sea, once it casts its spell, holds one in its net of wonder forever. Jacques Yves Cousteau
Warm-up Based on your research last night - What do you think we should do about the phenomenon of restaurants and fish markets selling certain fish under pseudonyms? Why do you think the recommendation for a particular species might differ between guides?
Pre-movie discussion • Are you a ‘responsible’ fish eater? • When did industrialized fishing begin? • How do you think fish populations are doing overall? • Do you think there is a critical population size for wild animals, below which they can’t recover?
Where have all the fish gone? • Economic and social importance of one species • Do you think this impacted people outside of New England? Why or why not? • What would the rippling effects of a fishery collapse have on society/economy?
Recent history of fishing • In groups of 4 • Examine the following scientific data related to fishing • Come to a consensus on what it means to be ‘overfished’ • Is this a label we can put on a single stock? • Or is this a category for the whole ocean?
Data set 1 – Species Diversity The maps you will study in this part of the investigation are species density maps. This means that the data you are looking at is the total number of species per square kilometer (or mile) of ocean, a measure of marine biodiversity (variety of life in the oceans). The data are for 1 decade for each of the following decades: 1960’s, 1970’s, 1980’s, 1990’s
Data Set 1 - Stop and Discuss 1: How does the overall color of the map change over time? What does this imply about the overall diversity of fish in the sea? 2: Can you identify any "hotspots" (areas with larger concentrations of species diversity than the surrounding ocean)? Do they persist over time?
Data Set 2 - Species Density Graphs Experts have found that large numbers of predator fish like tuna and billfish (large fish such as swordfish and marlins, that are characterized by long sword-like bills) are commonly found in biodiversity hotspots. This means that the abundances (or species density) of tuna and billfish are good indicators of overall marine biodiversity. There is a striking contrast between the level of marine biodiversity 50 years ago and that seen today. Environmental changes are often responsible for fluctuations in the sizes of fish communities from year-to-year. However, global declines in fish abundances over longer timescales are believed to be primarily driven by overfishing.
Data Set 2 - Stop and Discuss 1: Why is it important to have species diversity in the oceans? 2: Why do you think large predatory fish are important for maintaining the balance of marine ecosystems? Why are they important to the sustainability of the fishing industry?
Data Set 3 – Depletion of large predatory fish According to a 2003 paper published in Nature industrialized fisheries typically reduced community biomass by 80% within 15 years of exploitation. The study’s authors concluded that declines of large predators in coastal regions have extended throughout the global ocean and could have potentially serious consequences for ecosystems. Their main point was this: 90 % of all large fish including tuna, marlin, swordfish, sharks, cod and halibut are gone.
Data set 3 – Stop and Discuss 1: What role do large predators play in an ecosystem? 2: What role do keystone species play in an ecosystem? 3: What could happen to an ecosystem if large predators and/or keystone species are removed?
An animated map of changes in catch per unit effort • Link to Quicktime: http://ram.biology.dal.ca/~myers/depletion/