Download
1 / 47
470 likes | 630 Views
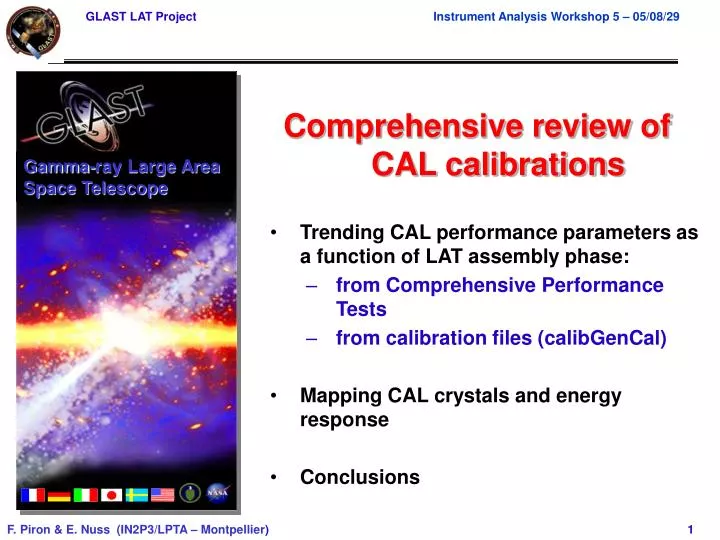
Gamma-ray Large Area Space Telescope. Comprehensive review of CAL calibrations. Trending CAL performance parameters as a function of LAT assembly phase: from Comprehensive Performance Tests from calibration files (calibGenCal) Mapping CAL crystals and energy response Conclusions.

E N D
Gamma-ray Large Area Space Telescope Comprehensive review of CAL calibrations • Trending CAL performance parameters as a function of LAT assembly phase: • from Comprehensive Performance Tests • from calibration files (calibGenCal) • Mapping CAL crystals and energy response • Conclusions
Trending CAL performance parameters : an introduction 1/5 • Let’s start with an example: pedestals • Define parameters • pedestal positions • pedestal widths • Define phases • pre-ship (“Pshp”) • post-ship (“SLAC”) • 8 towers in GRID (“8T”) • Trend parameters in 3 steps • Raw plots: plot raw values for each channel • History plots: plot parameters variation w.r.t. first phase (“Reference=Pshp”) • Summary plots: to have a first quick look • Store plots in 1 pdf file per CAL module (147 pages for calibGenCal trending, 133 for CPTs !!) and scan it!
Trending CAL performance parameters : an introduction 2/5 raw plots 1 face distribution 4 energy ranges 48 channels Pedestal positions Pedestal widths
Trending CAL performance parameters : an introduction 3/5 history plots 1 channel 1 energy range 3 phases Change of TPS before inserting in the GRID Variation (phase 0 ALWAYS 0) Pedestal widths Pedestal positions
Trending CAL performance parameters : an introduction 4/5 history plots 1 face Mean+-RMS, MIN and MAX RMS, 0.5(MAX – MIN) 4 energy ranges 48 channels Pedestal positions Pedestal widths
Trending CAL performance parameters : an introduction 5/5 summary plots Change of TPS before inserting in the GRID RMS and 0.5(MAX – MIN), summed over all last histograms Sometimes expressed in percentage
Trending CAL performance parameters from CPT’s 1/15 • What do we trend ? • Compute pedestals: we trend position and width • Check optical response (with muons): • a test for changes in the PDA (photo-diode assembly) optical bond quality is made from the ratio of LE or HE diode signals • we trend LE+/LE-, LE+/HE+ and LE-/HE- • Determine and trend optimal charge injection time delay (TACK DELAY) under timed readout • Calibrate electronic gains (with CI): • we trend the lowest and highest relative gains (w.r.t. nominal gains) • these gains are chosen because any drift from the nominal value would be most greatly amplified • Determine front-end integral non-linearity and noise (with CI): we trend noise, non-linearity (deviation from linear fit in %) and DAC2ADC slope • Characterize FLE, FHE, LAC and ULD DAC settings (with CI): we trend the coarse range DAC2ADC slopes • Which phases ? Pre-ship, Post-ship, 8T
Trending CAL performance parameters from CPT’s 2/15 T00-FM104
Trending CAL performance parameters from CPT’s 3/15 T04-FM105
Trending CAL performance parameters from CPT’s 4/15 T01-FM103
Trending CAL performance parameters from CPT’s 5/15 T05-FM102
Trending CAL performance parameters from CPT’s 6/15 T08-FM107
Trending CAL performance parameters from CPT’s 7/15 T09-FM106
Trending CAL performance parameters from CPT’s 8/15 T12-FM110
Trending CAL performance parameters from CPT’s 9/15 T13-FM108
Trending CAL performance parameters from CPT’s 10/15 T12-FM110 • Lack of statistics ?
Trending CAL performance parameters from CPT’s 11/15 T00-FM104 T04-FM105
Trending CAL performance parameters from CPT’s 12/15 T01-FM103 T05-FM102
Trending CAL performance parameters from CPT’s 13/15 T08-FM107 T09-FM106
Trending CAL performance parameters from CPT’s 14/15 T12-FM110 T13-FM108
Trending CAL performance parameters from CPT’s 15/15 Check the fit for these guys…
Trending CAL performance parameters from calibration files 1/16 • What do we trend ? • Compute pedestals: we trend position and width • ADC response: • fit DAC to (pedestal subtracted) ADC in a region away from non-linearities • we trend xing value and DAC2ADC slope • Characterize asymmetry functions for small (S) and large (L) diodes: • Compute left/right ratios (L/L, L/S, S/L or S/S) as a function of log segment (except 2 segments at the log ends) • fit a linear function (though not well suitable...) • we trend xing value and slope • Energy calibration: we trend the small and large diode MeV per DAC constant • Which phases ? Pre-ship, 6T, 8T
Trending CAL performance parameters from calibration files 2/16 T00-FM104
Trending CAL performance parameters from calibration files 3/16 T01-FM103
Trending CAL performance parameters from calibration files 4/16 T05-FM102
Trending CAL performance parameters from calibration files 5/16 T08-FM107
Trending CAL performance parameters from calibration files 6/16 T09-FM106
Trending CAL performance parameters from calibration files 7/16 T12-FM110
Trending CAL performance parameters from calibration files 8/16 T13-FM108
Trending CAL performance parameters from calibration files 9/16 T00-FM104 T01-FM103 Energy gains are larger (and stable) in the GRID
Trending CAL performance parameters from calibration files 10/16 T00-FM104
Trending CAL performance parameters from calibration files 11/16 T01-FM103
Trending CAL performance parameters from calibration files 12/16 T05-FM102
Trending CAL performance parameters from calibration files 13/16 T08-FM107
Trending CAL performance parameters from calibration files 14/16 T09-FM106
Trending CAL performance parameters from calibration files 15/16 T12-FM110
Trending CAL performance parameters from calibration files 16/16 T13-FM108
Mapping CAL crystals and energy response • Use TKR tacks (Tkr1XYZDir) and CAL tracks (CalXYZDir) • Select events (% is given for 2 towers) • CalZDir<1 (90%) • TkrNumTracks==1 (80%) • >6 hits above 2 MeV in at least one tower (25%) • Data set: • MC: 2 tower surface muons (22%) • Data (Merit and Svac tuples): • 2T : B/2 + B/10 + B/13 = 20h20’ (18%) • 4T : B/10 + B/13 = 2h00’ (22%) • 6T : B/2 + B/10 + B/13 = 20h00’ (24%)
Comparing TKR and CAL extrapolated tracks RMS of difference in lateral position E < 2 GeV E > 3.5 GeV multiple scattering ?? From Benoit’s note (4GeV) start of track end of track RMS of difference in longitudinal position 1.4 mm 0.8 mm
Comparing TKR extrapolated track with MC truth 2 mm RMS of difference in lateral position E < 2 GeV E > 3.5 GeV 0 mm 0.9 mm RMS of difference in longitudinal position E < 2 GeV E > 3.5 GeV 0.3 mm multiple scattering effect is dominant
Comparing CAL extrapolated track with MC truth 14 mm RMS of difference in lateral position E < 2 GeV E > 3.5 GeV 0 mm RMS of difference in longitudinal position E < 2 GeV E > 3.5 GeV TKR-CAL discrepancy is not due to multiple scattering in CAL
Mapping CAL crystals using TKR extrapolated tracks Divide each crystal in 9 (3mm) * 54 (6mm) bins Map of hits per bin Map of mean energy per bin
Mapping CAL crystals using TKR extrapolated tracks 20 MeV 50 0 0 MeV 140 Map of hits per bin
Crystal longitudinal energy response profile (tower0, layer0) +10 % -10 % 2 towers 6 towers
Distribution of MPV’s – 2 and 6 towers 2 towers: <MPV> = 11.25 +- 0.007 MeV 6 towers: <MPV> = 11.58 +- 0.004 MeV
Distribution of MPV’s – 4 towers 4 towers: old calibration 2 peaks at 10.8 and 11.2 MeV 4 towers: new calibration <MPV> = 11.41 +- 0.05 MeV
Conclusions • Trending and crystal mapping show calibration is stable • variations in pedestals and MeV/DAC related to change of TEM power supply • definition of some parameters has to be improved (e.g. asymmetry slopes) • Need for a better way to extract csv and calibration files from database to extend the trending to other LAT assembly levels • To do: • redo 2 tower calibration using muons from B10 runs and CI from 8T (4T calibration already re-done this way) • reprocess 2T data using this new calibration (4T already available) • calibrate flight gains using muon gain calibration + relative gains