Download
1 / 26
260 likes | 280 Views
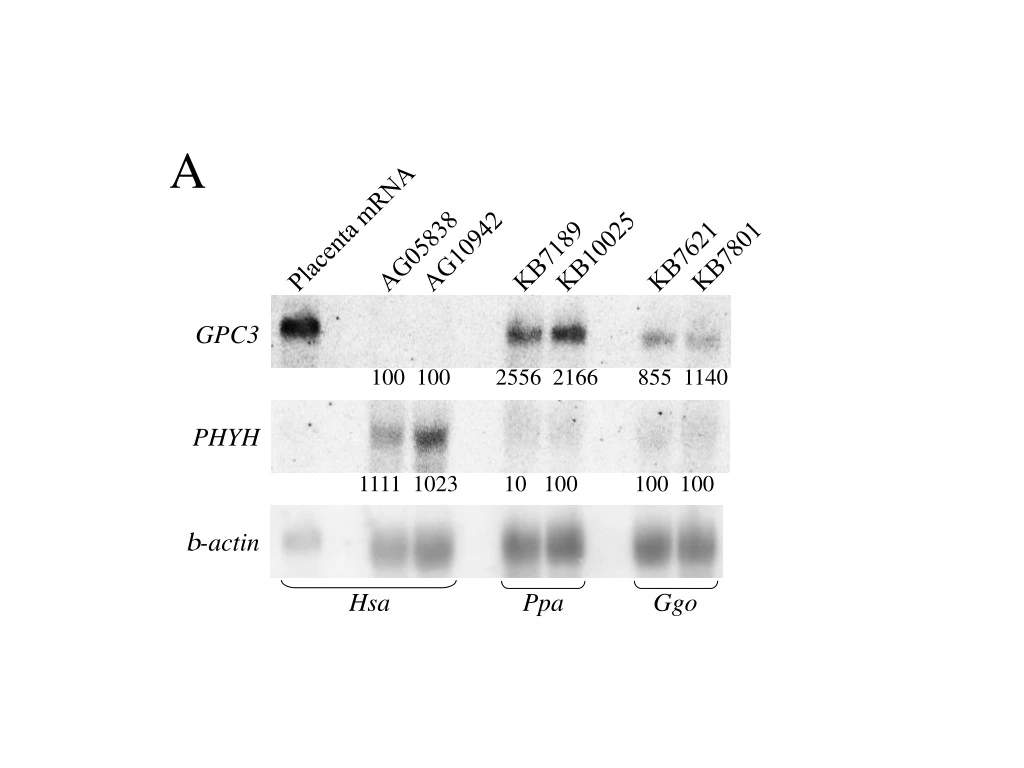
This study compares gene expression in placenta using both Northern blot analysis and microarray hybridization. The normalized signal intensities for each gene are evaluated and compared to b-actin or 28S rRNA levels.

E N D
A Placenta mRNA AG05838 AG10942 KB10025 KB7189 KB7621 KB7801 GPC3 100 100 2556 2166 855 1140 PHYH 1111 1023 10 100 100 100 b-actin Hsa Ppa Ggo
B AG13151 AG07999 KB10025 KB6884 KB8592 KB8594 MYLK 1251 712 207 119 259 265 TGFB1 13283 12884 1206 1178 1763 2230 b-actin Hsa Ppa Ggo
C AG04659 AG05414 AG11020 KB8025 KB7033 KB5275 KB8840 KB8592 KB8594 GSTT2 180 100 203 1160 834 803 100 246 219 LAMP1 10888 8629 8294 961 978 1123 7560 7559 6215 b-actin Hsa Ppa Ggo
D AG13151 AG07999 KB10025 KB6884 KB8592 KB8594 SDF1 3700 3233 100 175 299 313 b-actin Hsa Ppa Ggo
E AG04659 AG05414 AG11020 KB8025 KB7033 KB5275 KB8840 KB8592 KB8594 RGS7 100 100 100 241 1100 610 229 199 136 ITGA7 100 149 100 1310 554 380 2028 457 515 ZP3A 100 100 100 650 656 533 175 100 100 b-actin Hsa Ppa Ggo
F AG10942 AG05414 KB7033 KB5275 KB8592 KB8594 3.0 Kb SPTLC1 2.5 Kb 2.0 Kb 1904 1245 100 100 460 548 LAMA4 1177 1654 403 569 158 118 CCT4 18S rRNA 436 546 1420 1518 271 219 b-actin Hsa Ppa Ggo
G AG10942 AG05414 KB7033 KB5275 KB8592 KB8594 NID2 100 196 690 323 244 373 THBS2 10346 591 2060 1268 1931 406 28S rRNA Hsa Ppa Ggo
H AG04659 AG11020 KB7033 KB5275 KB8592 KB8594 IGFBP6 3338 3953 420 461 610 486 AKAP2 3852 2349 173 221 183 130 b-actin Hsa Ppa Ggo
Legend: The X-axis represents the samples evaluated by Northern blot analysis. The left-hand Y-axis represents normalized phosphorimager-based data hybridization signal intensities for each gene. These values are corrected for sample loading based on b-actin or 28S rRNA levels. The right-hand Y-axis represents normalized microarray hybridization signal (Methods).