Download
1 / 32
320 likes | 488 Views
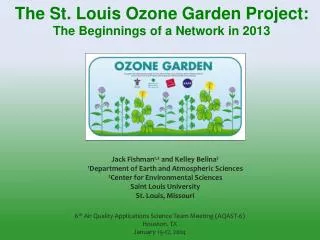
The St. Louis Ozone Garden Project: The Beginnings of a Network in 2013. Jack Fishman 1,2 and Kelley Belina 2 1 Department of Earth and Atmospheric Sciences 2 Center for Environmental Sciences Saint Louis University St. Louis, Missouri .

E N D
The St. Louis Ozone Garden Project:The Beginnings of a Network in 2013 Jack Fishman1,2 and Kelley Belina2 1Department of Earth and Atmospheric Sciences 2Center for Environmental Sciences Saint Louis University St. Louis, Missouri 6th Air Quality Applications Science Team Meeting (AQAST-6) Houston. TX January 15-17, 2014
What is an Ozone Garden? -A public education and outreach exhibit with plants that are sensitive to ozone air pollution. -With ozone (O3) and weather monitoring equipment. -Panels describe ground-level O3 air pollution and its effects on plants. -Leaf damage data is collected. The increasing levels of background O3 air pollution and its effects on the environment are little know components of global change. Trend in St. Louis O3 Concentrations 1980-2012: Dirty Air is Getting Cleaner, Clean Air is Getting Dirtier Youth Exploring Science (YES) student collecting O3 injury data on cutleaf coneflower leaves in the Saint Louis Science Center/Forest Park garden in summer 2013. Despite the fact that urban air has gotten cleaner, average background concentrations of O3 are now above the threshold where damage to plants can now be observed
Highlights in 2013 Three Ozone Gardens in St Louis in 2013 -Saint Louis Science Center (SLSC) – 2nd year -Grant’s Farm – 1st year -Southwestern Illinois College (SWIC) – 1st Year St. Louis Science Center Grant’s Farm SWIC Grant’s Farm SWIC
Highlights in 2013 More Ozone-injury Observed at the SLSC garden in 2013 Despite Considerably Lower O3 Concentrations Common Milkweed in 2013: • Stippling gradually progresses to become prominent dark areas • Older leaves show more advanced symptoms than younger leaves • After stippling, leaves can become chlorotic (yellow) and/or necrotic (cell death) and often drop early from the plant 2012: 40 O3 Days, 170 Exceedances 2013: 7 O3 Days, 15 Exceedances Common Milkweed in 2012: Only minimal damage observed in 2012, and none until September Cutleaf Coneflower and La Chipper Potato: Both plants exhibited damage in 2013
Highlights in 2013 Observable and Measurable Differences in Sensitive and Tolerant Soybean Cultivars Planted in 2013 Sensitive soybean cultivar (A.K. Harrow, front) and tolerant cultivar (Williams 82,rear) planted at SWIC in 2013
From June 2012 AQAST Meeting A National Network of Ozone Gardens Using AQAST Members
Status of National Network of Ozone Gardens in 2014 Open in 2013 Planned for 2014
Visualizing the Impact of Global Change on the Environment: The St. Louis Ozone Garden Jack Fishman1,2,3Kelley M. Belina,2,3 and Cindy H. Encarnaciòn4 1Department of Earth and Atmospheric Sciences 2Center for Environmental Sciences 3Center for Sustainability Saint Louis University St. Louis, Missouri 63108 4Saint Louis Science Center St. Louis, Missouri 63110 Submitted Bulletin American Meteorological Society February, 2013 Revised August, 2013 (response to referees) 2nd Revision October, 2013 (editor requested shift with more education focus) Forwarded to BAMS Editor-in-Chief Still Waiting for Formal Acceptance! From Jeff Rosenfeld (Editor-in-chief): 2 December 2013 Hi Jack, Peter asked me to take a look at the manuscript and I have done so. I was very close to making some recommendations to you and then got completely derailed with an unexpected health issue before Thanksgiving. I'm sure you'll hear from me, or from another editor, soon. The delay will be worth your while, even if it doesn't seem like it at the moment. --Jeff
Part II: Can Information on Crop Spectral Signatures Be Used by Agribusiness to Improve USDA Commodity Forecasting? Potential Future Collaboration with Wasit (Ghulam) Wulamu(SLU)
Ongoing Research at Saint Louis University Sustainable Agriculture under Changing Climate: Nutrient Uptake and Grape Quality Study under Various Soil Moisture Conditions Drought bed Irrigated bed Sensitive soybean cultivar (A.K. Harrow, front) and tolerant cultivar (Williams 82,rear) planted at SWIC Ozone Garden in 2013 Potential Tiger-Team Proposals: Determine Spectral Signatures for O3-Tolerant and O3-Sensitive Soybean Cultivars Grape plants under drought-stressed and irrigated conditions exhibit different spectral signatures
rice: 99-15 Hyper-spectral remote sensing has been used to differentiate cultivars of rice (Tong et al., 2004) Rice: 99-15 Rice: 5021 80 bands
Future IPCC Scenarios Suggest Tropospheric O3 will Increase by 25% • Decrease in yield because of increased O3 is an ongoing research concern of St. Louis-based Monsanto
Future IPCC Scenarios Suggest Tropospheric O3 will Increase by 25% Future IPCC Scenario: Trop O3 +25% Decreased Yield ~10% • Decrease in yield because of increased O3 is an ongoing research concern of St. Louis-based Monsanto
Ongoing Research at SLU Focused on Growing Grapes in an Urban Environment (Emphasis on Urban Sustainability) Spectral Measurements using PSR-3500 Spectral resolution 3.5nm (350-1000nm); 10nm @ 1500nm; & 7nm @ 2100nm Leaf Area Index (LAI) from LAI-2200 Plant Canopy Analyzer
Purpose of SLU Research is to Characterize Differences in Spectral Signatures for Two Different Grape Varieties under Drought and Non-Drought Conditions Ultimate Goal: Transform Vast Tracts of Urban Land (either currently vacant or where derelict buildings stand) into Functional Vineyards • But first we need to know which grapes grow best • Information in the “red edge” portion of the spectrum provides insight into growth of plant
Application of TEMPO Air Quality Satellite Measurements to Improve USDA Commodity Forecast Models TEMPO will provide measurements in the near-red (red edge) portion of the spectrum that can be used to measure chlorophyll fluorescence
Potential SLU-Monsanto Collaboration • Initial Teleconference, January 2014 - Jack Fishman & WasitWulamu from SLU -Marie Petracek & Mike Woods from Monsanto • Mutual Interest in Understanding Impact of Ozone on Soybean Crop Yield • Use of Monsanto Soybean Test Facility near Belleville IL (~40 km East of STL) • Details for Future Plans to be Discussed - Use of Test Facility to make ground-based spectral measurements on multiple cultivars with known sensitivity to O3 (summer 2014) - Use of Test Facility for future aircraft measurements (2015 and beyond) 2014 “Pre-Tiger Team Activity” • Hand-held spectroscopic measurements at 3 Local Ozone Gardens • Establish first baseline soybean spectral signature • Determine spectral signature of O3 foliar damage • Hand-held spectroscopic measurements at Monsanto Field Site 2015 Tiger Team Proposal • SLU aircraft to be available for in situ and remote sensing over Monsanto Field Site • Leverage SLU aircraft capability to obtain spectral signatures over Monsanto field site • Compare airborne measurements with ground-base spectroscopic signatures
Summary Ozone Garden: • Three Gardens in St. Louis, Three more started in 2013 • Two (or More) Planned for 2014 • Foliar Damage Clearly Identifiable at SLSC in 2013 - Annuals need one year to establish - Soybean Species Introduced in 2013 Spectral Measurements (Unplanned Activity for Summer 2014) • Provide Baseline Spectral Measurements of Ozone Sensitive and Ozone Tolerant Cultivars at 2014 STL Ozone Gardens to Provide Baseline Spectral Signatures • Expand Above Measurements to Monsanto Field Site in Illinois (not currently funded) Use Findings for 2015 Tiger Team Proposal
Production Estimates and Crop Assessment Division (PECAD) Model Knowledge and Forecasts of Crop Production Important to U.S. Agribusiness
Production Estimates and Crop Assessment Division (PECAD) Model: Currently: Only LCLU Satellite Data Used as Input
Production Estimates and Crop Assessment Division (PECAD) Model Can Inclusion of TEMPO Data Improve Crop Forecasts?
Vitisriparia is also know as River Bank Grape. It produces dark fruit that are appealing to both birds and people, and has been used extensively in commercial viticulture as grafted rootstock and in hybrid grape breeding programs. Vitisrupestrisis a species of grape native to the Southern and Western United States that is known by common names Sand Grape. It is used for breeding several French-American hybridsas well as many root stocks. It has been listed as threatened or endangered by Indiana, Kentucky, Pennsylvania, and Tennessee because Heavy use of grazing and herbicides have killed out much of the population. The red edge of vegetation is an area usually centered around 720nm and represented by the typical sharp rise in reflectance in the 680-760nm range of classic vegetation spectral signature. When plants are healthy and are producing more chlorophyll, the red edge tends to shift toward the right to longer wavelength. This is also accompanied by an increase in the absorption trough at 680nm as the plant absorbs more energy in the photosynthetic process. When plant is stressed, such as in the case of excessive heavy metals in the soil, temperature, or lack of water, the spectra tends to shift toward the left and shorter wavelengths. Stress also tends to produce an increase in reflectance at 630nm absorption trough because less slight is being utilized for photosynthesis and chlorophyll. In our case, the red edge reflectance of river bank grape is always centered at the longer wavelength than sand grape. Furthermore, the 680nm chlorophyll absorption trough is always lower than its counterparts. So, it seems the river grape is healthier than sand grape in both condition throughout the growing season. This is also visibly distinguishable in the field. I am not pretty sure which species is drought resistant ,but I assume sand grape is more resistant than the river bank grape based on its name and places it found in nature. If this is the case, supposedly, the sand grape should grow healthier than the another due to its genetic traits may be. However, due to wet weather or irrigation scheme plants might not get enough stress that makes drought-resistant species survive, non-resistant suffer.
Reduction of Soybean Crop Production by Ozone (a Few Percent) Costs Several Billions of Dollars to the American Farmer Value of U.S. Soybean Crop • Crop Value • Yearbillion $$ • 2012 43.2 • 2011 38.5 • 37.6 • 2009 32.1 • 2008 29.5 • 2007 27.0 • 2006 20.5 • 2005 17.3 • 2004 17.9
Wild Plant Conservation Milkweed is the monarch caterpillar’s primary food source Decreasing the amount of healthy milkweed effects monarch butterfly populations Common milkweed in the SLSC Ozone Garden in 2013 Monarch caterpillar on common milkweed in the SLSC Ozone Garden in 2012 Monarch butterfly Milkweed flowers
National Crop Loss Assessment Network (NCLAN) Conducted Studies in the 1980s to Assess Impact of Ozone on Crops Many crops show decreased yield ~40 ppb
Analyses Conducted in 1980s and 1990s Confirm Hypothesis that Tropospheric Ozone Has Increased during 20th Century (from Marencoet al., J. Geophys. Res., 99. 1994)
Analyses Conducted in 1980s and 1990s Confirm Hypothesis that Tropospheric Ozone Has Increased during 20th Century Observations from 1950/1960s Observations from 1990s Montsouris Measurement ~1900 From Staehelin, et al., Atmos. Environ., 28, 75-87, 1994
Background Ozone Concentrations Still Increasing into Beginning of 21st Century Mace Head (Ireland) Pacific Coast (US) (From Cooper et al., Nature, 463, 2010)
Selection of water sensitive bands • Canopy reflectance: • Leaf Optics • Soil reflectance • Canopy structure • LAI N Ca+b Cm Cw Prospect Lillesaeter SailH Tempo LAI