Download
1 / 5
50 likes | 209 Views
This guide introduces the use of PROC SUMMARY in SAS for generating quick data summaries. It highlights key features, such as the requirement to pre-sort data and the ability to produce a table of output that can be further manipulated, in contrast to PROC TABULATE. The basic syntax covers sorting the dataset and utilizing PROC SUMMARY to obtain various statistics, including mean, standard deviation, and median. Additionally, it discusses quirks associated with PROC SUMMARY, including the automatic addition of new variables and managing the active dataset.

E N D
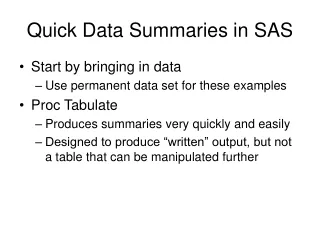
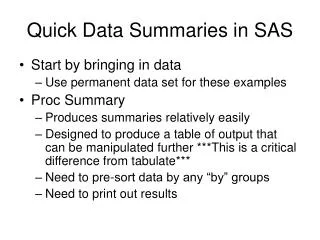
Quick Data Summaries in SAS • Start by bringing in data • Use permanent data set for these examples • Proc Summary • Produces summaries relatively easily • Designed to produce a table of output that can be manipulated further ***This is a critical difference from tabulate*** • Need to pre-sort data by any “by” groups • Need to print out results
Quick Data Summaries in SAS • Basic Summary Syntax: Proc sort; By var1 var2; Run; Proc summary; By var1 var2; Var variable3; Output out=new_table mean=mean_name n=n_name….; Run; Proc print; Run;
Statistics available in Proc Summary • Mean, n, standard deviation, standard deviation, variance, coefficient of variation, sum • Minimum, maximum, range, number of missing observations, median
Some Quirks of Proc Summary • Whenever you use proc summary, it adds two new variables: _type_ and _freq_ (note underscores at beginning and end of variable names • _freq_ indicates the number of observations • _type_ indicates whether the output is a matrix or not • You can ignore these variables in virtually all cases • You need to remember what is the “active” dataset, or specify the dataset that summary will operate on • The active dataset is the most recently used dataset by default
Shannon’s Diversity Index H= -∑ pi ln(pi)