Chapter 10 Data Collection Methods
Chapter 10 Data Collection Methods. Contents. Sources of Data Primary Data Secondary Data Data Collection Methods Part 1: Interviews Part 2: Questionnaires Part 3: Other Methods of Data Data Analysis Quantitative data analysis. Source of Data. Primary Data


Chapter 10 Data Collection Methods
E N D
Presentation Transcript
Contents Sources of Data Primary Data Secondary DataData Collection Methods Part 1: Interviews Part 2: Questionnaires Part 3: Other Methods of DataData Analysis Quantitative data analysis
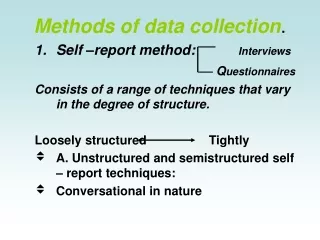
Source of Data • Primary Data • Refer to information obtained firsthand on the variables of interest for the specifics purpose of study • Example; from individuals, focus groups and panel of respondents • Individuals; direct interviewed, administrated questionnaires or observed • Focus group; consist a group of members discussions on a particular topic, concept etc • Similar to focus group but meet more than one time session
Secondary data • Secondary data is data collected for some purpose other than the present research purpose • All previously gathered material • Data gathered and recorded by some one else prior to and for the purposes other than the current project is often: • Historical • Already assembled • Needs no access to subjects
Advantages of secondary data • Access – quick & easy to obtain • Affordable – mostly free; or at minimal cost • Availability – many sources – electronic availability • Retrospective – allows researchers to go back in time; enables prediction or forecasting of future events • Only available access – tourism data on International visitor arrivals • Quality – data sources produced by Government meet high research standards; journals – articles reviewed • Ability to enhance primary data – base to study
Disadvantages of secondary data • Relevance & accuracy – as data has been collected for purposes other than the specific research problem, usefulness may be limited. • Measurement units in secondary data may not match the researcher’s needs – different income level groupings or measured in different ways – household or per capita income • Recency of the data – too old to be of value • Not easy to locate • May be an incomplete data set
Free Data Set Online • A free source of US data • http://www.economy.com/freelunch/ • Yahoo finance • http://finance.yahoo.com/ • Economic Journal Dataset online • http://www.res.org.uk/economic/datasets/datasetdefault.asp • Journal of Applied Econometrics Dataset Archive • http://qed.econ.queensu.ca/jae/ • Journal of Money, Credit and Banking • http://webmail.econ.ohio-state.edu/john/IndexDataArchive.php
Free Data Set Online • International Financial Statistics (free trial) • http://ifs.apdi.net/imf/logon.aspx • World Bank website • http://www.worldbank.org/ And many more, hope you guys can explore using search engine such as google, yahoo, etc.
Public Documents • Created to ensure normal functioning of offices and departments are maintained at every level of government. • Include proceedings of government bodies, court records, state laws and ordinances, official statistics, vital statistics (birth and death records), directories, almanacs, publication indexes and data from internet. • Private Documents • Are information produced by individuals or organizations about their own activities that is not intended for public consumption. • Include businesses’ personnel and sales records, inventories, and tax reports, hospital patient records, college transcripts.
Mass Media • Written records in newspapers, magazines, television, radio, films, internet. • Analyzed verbal content and visual content. • Social Science Data Archives • Repositories of data collected by various agencies and researchers that are accessible to the public.
Evaluating Secondary Data Does the data help to answer questions set out in the problem definition? Applicability to project objectives Does the data apply to the time period of interest? Does the data apply to the population of interest?
Do the other terms and variable classifications presented apply? Applicability to project objectives Are the units of measurement comparable? If possible, go to the original source of the data? Accuracy of the data
Is the cost of data acquisition worth it? Accuracy of the data Is there a possibility of bias? Can the accuracy of data collection be verified?
Challenges • Overwhelming increase in amount of printed secondary data • Multimedia sources & transfer modes • hardcopy, disks , Internet has lead to an explosion of available information. • Researchers Must: • Learn to properly handle secondary data • Know the classifications of secondary data • Know the advantages & disadvantages of secondary data • Know how to evaluate the information • Consistency of the sources that he/she obtained the secondary data set.
Processing the data • Having collected data, the researcher must quantify it, put it in computer-readable form, and analyze the data statistically. • The stage for data analysis is set by the researcher’s theoretical model of anticipated relationships, as this limits and guides the kinds of analyses that can be carried out.
Facts or data never speak for themselves, they must be analyzed and interpreted [data massaging]. • Data analysis begins with a statement of hypotheses, the construction of a theoretical model, or at the very least, implicitly anticipated relationships among a set of variables.
Processing Data • Coding - Before data are entered into a computer, coding schemes must be developed for every variable or question. Only applied for primary data normally questionnaire
ii. Editing • Is a quality control process applied mostly to surveys to ensure that the information on a questionnaire or interview schedule is ready (complete, error free and readable) to be transferred to the computer for analysis. • Editing is carried out both during and after the process of data collection, and much of it occurs simultaneously with coding. Again it is for primary data analysis.
Entering the Data - The data that are entered into the computer are stored on a disk or other media in a computer file, called a data file. • Cleaning • Involves eliminating errors in coding and in transmitting the data to the computer. • Data processing errors are avoidable by exceedingly careful about entering the data and to use every possible method of checking for mistakes. • Data Analyses
Data Analysis Strategy • known characteristics of the data (level of measurement: nominal, ordinal, interval, ratio) • properties of statistical tests • assumptions underlying tests • data analysis strategy – link to objectives and ultimately the research problem
Evaluation of the data’s validity • Methodology used to collect data – critically examine sample design, response rate questionnaire design and administration, field work procedures, data analysis techniques and reporting • Error – accuracy of data – errors in each stage of the research process • Currency – when the data was collected • Objectivity – purpose for which the data was collected
Nature – the content of the data – how key variables are defined; units of measurement; categories used etc – how consistent are they with researcher’s needs • Dependability of the data – examine the expertise, credibility, reputation and trustworthiness of the source.
Data Analysis • a group of methods and techniques that can turn data into valuable information and insights and help researchers to draw defensible and actionable conclusions. • descriptive statistics –frequency distributions; measures of central tendency; variance; dispersion
inferential statistics – hypothesis testing • univariate • bivariate – association (relationship) or differences • Multivariate • Forecasting
Types of Economic Data • Time Series Data • Cross-sectional Data • Panel Data
Time Series Data • Data is collected at specific points in time • The data are ordered by time • The underlying phenomenon which we are measuring (e.g. GDP or wages or interest rates, etc) is refereed to as a variable • Time series data can be observed at many frequencies
Time Series Data… • Commonly used frequencies are: • annual (i.e. a variable is observed every year) • quarterly (i.e. four times a year) • Monthly, weekly or daily • Hourly (financial data such as changes in the price of stocks) • Notation: Yt an observation on variable Y at time t
Cross-Sectional Data • Data that is characterized by individual units • These units might refer to people, companies, sectors or countries • The ordering of the data typically does not matter • Notation: Yi an observation on variable Y for individual i. • Data set run from individual i = 1 to N • N indicates the number of cross-sectional units
Panel Data • Data sets have both a time series and a cross-sectional component • For example, GDP for 13 ASEAN countries from 1980 – 2004 • N = 13 and T = 25 years • Notation: Yit an observation on variable Y for unit i at time t
Quantitative data Analysis • Numerical representation and manipulation of observations for the purpose of describing and explaining the phenomena that those observations reflect. • In economics field also known as econometrics. It concerns the development of statistical methods to test the validity of economic theories.
Thus, the knowledge of econometrics is crucial in conducting the data analysis in economics research. • Basic knowledge of econometric theory is necessary to understand what may (or may not) be done in applied quantitative economic research, when we deal with secondary data.
Goals, objectives and aims of Econometrics • Formulation of econometric models in an empirically testable form. • Empirical verification (Estimation and testing) of these models with observed data [estimating coefficients of economic relationships]. • Making prediction, forecasting future values of economic variables or phenomena and policy recommendation
Procedure of quantitative data analysis • Data entry – enter the data into the package or Excel spreadsheet. • Various econometrics software such as EViews (Econometrics Views), SHAZAM, RATS, MICROFIT, PcGive, PcFilm, TSP, GAUSS EasyReg). It is part of the process of data collection before the estimation process. • Primary data analysis package such as SPSS.
After the data entry to the relevant program (example: E-views) we are ready for the estimation or the data. • To check on the data, we may plot the data to ensure it is free from human error. • Despite that now days, the data are ready in excel format in most of the central banks, IFS or some other institutions.
The estimation (statistical) techniques could includes descriptive, regression (simple and multivariate) and forecasting analysis. • Hypothesis testing is usually adopted here. • Diagnostic checking for the model
Interpretation of the results based on economic theories. Please be advice that the interpretation is not limited to the statistical interpretation (example: significant or not). • Make conclusion, implication, policies and to resemble the reality of the world. • Present or send for publication consideration the term paper of economics research.
Descriptive Analysis • Descriptive statistics fall into one of two categories: measures of central tendency (mean, median, and mode) or measures of dispersion (standard deviation and variance).
Measures of central tendency • mean • sum all values in distribution, then divide by total number of values • median • middle point within entire range of values • not distorted by outliers • mode • most frequently occurring value
Measures of dispersion • amount of variation in a sample • compare levels of variation in different samples • is there more variability in a variable in sample x than in sample y? • standard deviation • average amount of variation around the mean • impact of outliers is reduced
Regression Analysis • Regression is the most commonly used tool in econometric analysis. • Study of relationship between one variable called the explained/dependent variable and one or more other variables called independent/explanatory variable(s). • y - explained/dependent variable • x - independent/explanatory variable
Aims of Regression • To examine whether there exists a significant relationship between any of the x’s and y. • To analyze the effects of changing one or more of the x’s on y. • To forecast the value of y for a given set of x’s.
Bivariate analysis(analysis of two variables) • explores relationships between variables • search for co-variance and correlations • cannot establish causality • can sometimes infer the direction of a causal relationship • if one variable preceded the other
Multivariate analysis(three or more variables) • the relationship between two variables might be spurious • each variable could be related to a separate, third variable
Deterministic and Stochastic Relationships • There are two types of relationships: • deterministic or exact relationships. • Take the following model: • y = 3500 + 100x • The values for y can be exactly determined for given values of x. • stochastic or statistical relationships which do not give unique values of y for given values of x. • Suppose the model is specified as: • y = 3500 + 100x + u • By defining y in probabilistic terms, it cannot be exactly determined for given values of x. • Statistical relations are specified in probabilistic terms. • Regression uses statistical models.
Simple Vs Multiple Regression • Simple Regression - one independent variable • Multiple Regression - more than one independent variable
Why add an error term? • The relationship between economic variables is unlikely to be exact because of stochastic error. • Stochastic error is also known as random error, disturbance, or simply error term. • A (random) disturbance or error must be included in the exact relationships postulated by economic theory and mathematical economics in order to make them stochastic (in order to reflect the fact that in the real world, economic relationships among economic variables are inexact and somewhat erratic).
To account for the inexact relationship between economic variables, an error term must be included in our regression equation. • where stands for the error term. • Equation above is made up of deterministic component ( ) and stochastic component ( ). • The deterministic component determines the expected value of Y. This component tells us exactly by how much a change in X will be reflected in the change in Y.
However, in the real world, it is unlikely that variation in Y is solely explained by variation in X. • There are some variations in Y that cannot be explained by the model. • Econometric admit the existence of such unexplained variation by explicitly including a stochastic component in the model. • The inclusion of a (random) disturbance or error term (with well-defined probabilistic properties) is required in regression analysis for three important reasons.