Download
1 / 25
250 likes | 257 Views
The psychology and economics of women in leadership Alex Haslam, Michelle Ryan, Clara Kulich. The glass cliff. November 2003. FTSE 100 Cranfield Index Ranks companies in terms of the number of women on their board. 3 of the top 5 companies on Cranfield Index are under-performing

E N D
The psychology and economics of women in leadership Alex Haslam, Michelle Ryan, Clara Kulich
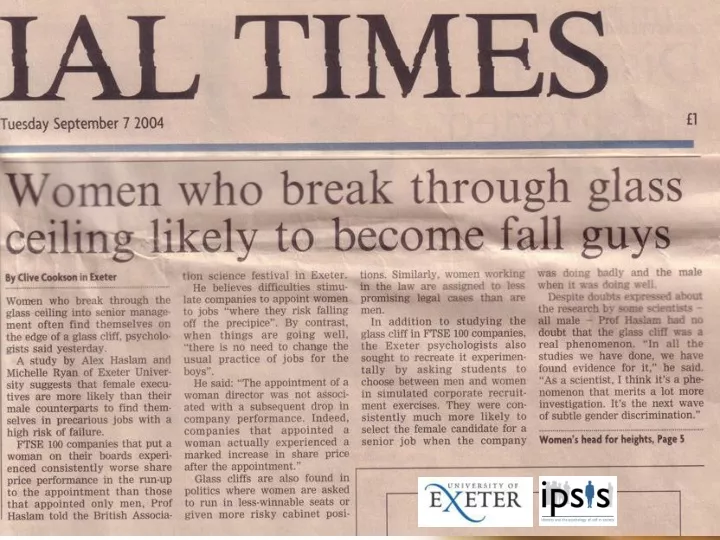
The glass cliff November 2003 FTSE 100 Cranfield Index Ranks companies in terms of the number of women on their board • 3 of the top 5 companies on Cranfield Index are under-performing • All of the bottom 5 are over-performing
The glass cliff “So much for smashing the glass ceiling and using their unique skills to enhance the performance of Britain’s biggest companies. The triumphant march of women into the country’s boardrooms has instead wreaked havoc on companies’ performance” The Times, Nov.11, 2003, p.21 Conclusion “Corporate Britain would be better off without women on the board.”
The glass cliff • There is a relationship between company performance and number of women on the board • But is the analysis correct? • Could the causal sequence be reversed? Perhaps women only get given senior positions when companies are doing poorly.
Relative company performance (%) The glass cliff Ryan & Haslam (2005) BJM • Detailed archival examination of FTSE 100 companies in 2003 provided support for this alternative interpretation: • Period prior to women’s appointment to company boards is characterized by poor company performance.
Word Spy • We dubbed this (unseen) tendency to appoint women to precarious leadership positions The Glass Cliff
The glass cliff • Does it matter? • To the extent that women are placed on glass cliffs (a) they are more likely to be ‘in the spotlight’ (b) there is a differential likelihood that they will fail, and (c) it is likely they will be blamed for negative outcomes that are not their fault (“the romance of leadership”)(Meindl, 1993). • Indeed this may help explain why women’s tenure of senior leadership positions is typically much shorter than men’s — e.g., US CEOs 8.2 vs 4.8 years (Blanton, 2005). ‘[I was] promoted to manager at a time when failure of the company was inevitable. In my estimation I needed 6 months to put new practices in place and put the company on an even keel — I was made redundant after three and a half months.’ Female Professional, 35
Participants asked to select a candidate for a leadership position in an organization doing well or doing badly. Establishing cause Experimental study Haslam & Ryan (2008) LQ • Is there any evidence that women are preferentially selected for precarious leadership positions? • Given a choice between multiple candidates. • But best candidates are a man and a woman whose applications are matched on key dimensions. • Which do they prefer and when?
The woman is preferred when the job is risky higher rank lower rank Establishing cause Experimental study Haslam & Ryan (2008) LQ Ranking of candidates
Establishing cause Demonstrated across a range of studies with: • Lead lawyer for a risky and highly criticized case • Financial director of a poorly performing company • Political candidate for an unwinnable seat ‘The only time to run a woman, is when things look so bad that your only option is to do something dramatic.’ John Bailey, Chair, National Democratic Party Committee (Burrell, 1993) Demonstrated with multiple samples: • Law, business, political science students • Business leaders • UK, Iceland, NL, US (Bruckmüller & Branscombe, in press, BJSP)
Establishing process • How do people explain glass cliffs (and is there any evidence to support their explanations)? Ryan, Haslam & Postmes (2007) JCM
1 2 3 ‘Speaking as a research scientist, I am disgusted with the way in which you have attempted to select a very limited group of participants and ask them extremely leading questions. Your approach is entirely unscientific.’ Male professional, 21 . Understanding process How do people explain and react to glass cliffs?
Implications for the gender pay gap Understanding managerial pay • Economic literature suggests that managerial pay is closely related to company performance, especially for pay elements such as bonuses and incentives. (Lemieux, 2008) • Psychological research into the romance of leadership (Meindl, 1993)suggests leaders are accorded disproportionately high power and agency. • Glass cliff research led us to suspect that both of these processes might be dependent on gender.
N = 201 professionals in the UK • Ps given information about a company that was either doing well or doing badly Implications for the gender pay gap Experimental study Kulich, Ryan & Haslam (2007) APIR • Company said to have either a male or a female CEO • Ps asked to allocate a bonus (extra weeks of pay)
Link between performance and reward is very strong for male CEO Where is the “romance” for women leaders? Implications for the gender pay gap Size of bonus (extra weeks of pay)
Implications for the gender pay gap Archival study I Kulich, Trojanowski, Ryan, Haslam & Renneboog (in press) SMJ But does this happen in the ‘real world’? • 192 matched female & male executive directors, UK listed firms (1998-2004) • Matched on company characteristics (industry and size) and director characteristics (position, tenure)
** Female Male ** Implications for the gender pay gap 350 300 250 200 £ '000 150 100 50 0 Salary Bonus Other direct Incentive pay Total pay compensation
Link between performance and reward is very strong for male CEOs Female Male Where is the “romance” for women leaders? Implications for the gender pay gap 12.0 10.0 8.0 Expected bonus (in £ '000) 6.0 4.0 2.0 0.0 -25.0 -20.0 -15.0 -10.0 -5.0 0.0 5.0 10.0 15.0 20.0 25.0 Company Performance (ROA)
Implications for company performance Archival study II Haslam, Ryan, Kulich & Atkins (in press) BJM • All UK FTSE 100 companies, 2001-2005 • Key measures: • Number and proportion of women on the board • Accounting-based company performance: ROA, ROE, • Stock-based company performance: Tobin’s Q • Tobin's Q compares the value of a company given by financial markets with the value of a company's assets. So, • > 1 over-valued • = 1 appropriately valued • < 1 under-valued
Mean Percentage of Women on Company Board Likelihood of Having a Woman on Company Board 11 .95 10 .85 9 .75 8 .65 7 .55 6 Year Year Implications for company performance • All UK FTSE 100 companies, 2001-2005 • A period of some change (increasing presence of women on boards — albeit tokenistic)
ROA ROE ROA ROE Replicating Ryan & Haslam .03 .04 .04 -.02 Tobin’s Q -.11* -.16** Implications for company performance W on Bd.? Year Tobin’s Q ROA ROE % W on Bd. .78** .19** W on Bd.? .13** Year .08 .14** -.05 ROE .18** .01 ROA .41** • Women’s presence on boards isn’t associated with objective underperformance (in fact the opposite). • But consistent with Ryan & Haslam (2005) it is associated with subjective underperformance. • It appears that financial markets are driven by psychology not economics (Akerlof & Kranton, 2005; Akerlof & Shiller, 2009)
Implications for company performance Over-valued Tobin’s Q Under-valued • Companies with a woman on the board are over-valued by 21% • Companies with all-male boards are over-valued by 68% • Companies with all-male boards have a valuation premium of 38%
-.21* -.06 -.14 -.16 -.07 -.23* -.07 -.08 -.08 -.09 -.26* -.08 -.08 -.08 -.07 -.28* -.12 -.11 -.12 -.05 -.36* -.19 -.23* -.24* -.21* Implications for company performance on Board? 2001 2002 2003 2004 2005 2001 2002 Tobin’s Q 2003 2004 2005 • What is the causal relationship here? • Evidence that (a) having women on the board leads to lower Tobin’s Q (r = -.21*) and that (b) having lower Tobin’s Q leads to women on the board (r = -.09) Both differ from 0 (Granger’s test); but (a)stronger than (b) (p = .01)
Conclusions • A body of evidence suggests that life above the glass ceiling is quite different for men and women (Ryan & Haslam, 2007, AMR). • In particular, women are given different opportunities (riskier, more precarious) different rewards (fewer, less contingent on performance) different reception (their arrival is greeted with skepticism, and seen as a signal of decline). • These are likely to be a source of stress and disidentification.
Conclusions • ‘Life at the top’ can be lonely and alienating for women. • Yet their presence is good, not bad, for objective performance. • We need to make conscious efforts to keep them on board — so that organizations, and society, can benefit from their contribution.