MATERIALS SCIENCE & ENGINEERING
Learn why Kα1 and Kα2 peaks are resolved at high angles in diffraction, importance of high angle peaks in lattice parameter calculation, and error reduction with increasing angle in this introductory e-book.

MATERIALS SCIENCE & ENGINEERING
E N D
Presentation Transcript
MATERIALS SCIENCE & ENGINEERING Part of A Learner’s Guide AN INTRODUCTORY E-BOOK Anandh Subramaniam & Kantesh Balani Materials Science and Engineering (MSE) Indian Institute of Technology, Kanpur- 208016 Email:anandh@iitk.ac.in, URL:home.iitk.ac.in/~anandh http://home.iitk.ac.in/~anandh/E-book.htm
Why are K1 and K2 peaks resolved at high angles? & Which ‘Line’ to use for lattice parameter calculation? • At higher Bragg angles the K1 and K2 lines are resolved(reason shown in the next slide) • Typically we use only the K1 lines for the calculation of lattice parameter • The error in the calculation of lattice parameter decreases with increasing angle → hence the high angle peaks should be used for lattice parameter calculation (instead of taking an average over all peaks or taking any of the intense low angle peaks)(as shown in slides to follow)
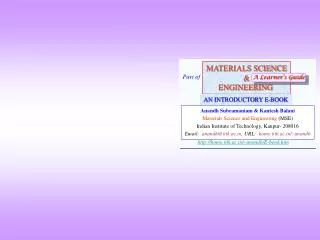
Why are K1 and K2 peaks resolved at high angles? • The K1 (CuKα1 = 1.540598 Å) and K2 (CuKα2 = 1.54439 Å) lines differ slightly in wavelength. Hence, in principle two separate peaks should be seen in the diffraction pattern. • Usually, at low angles these peaks are merged (i.e. seen as a single peak) and at high angles these peaks are resolved (seen as two separate peaks). The question is why? • This can be understood in terms of the variation of with (as in this case is not fixed) and the graphical (Ewald sphere) construction (upcoming slides). 200 K1 & K2 peaks resolved in high angle peaks(in 222 and 400 peaks this can be seen) 220 111 311 222 400 In low angle peaks K1 & K2 peaks merged
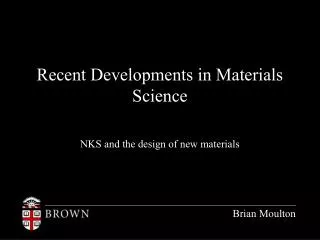
1 and 2 differ slightly in wavelength • The difference in the diffracted angle increases with an increasing angle of diffraction (for a given ). Plot of variation as above. • Hence, the 1 and 2 peaks are resolved at high angles Actually, the variation in 2 is to be seen
Which ‘Line’ to use for lattice parameter calculation? • Typically we use only the K1 lines for the calculation of lattice parameter. And this can be done at high angles as the K1 & K2 lines are resolved at high angles. • The error in the calculation of lattice parameter decreases with increasing angle → hence the high angle peaks should be used for lattice parameter calculation (instead of taking an average over all peaks or taking any of the intense low angle peaks) (as shown in slides to follow).
Let us calculate the error in d spacing as a function of the angle of diffraction For the same the error in Sin with
Error in d spacing Error in d spacing decreases with → hence high angle peaks have to be used for lattice parameter calculation
Determination of Lattice parameter from 2 versus Intensity Data Decreasing error Others methods exist for precise lattice parameter measurement (than just taking a single value)! * 1 , 2 peaks are resolved (1 peaks are listed)