Download
1 / 25
250 likes | 480 Views
BENEFIT-COST ANALYSIS financial and economic appraisal using spreadsheets. Consumer and Producer Surplus in Benefit-Cost Analysis (Campbell & Brown Chapter 7) Harry Campbell & Richard Brown School of Economics UQ, St. Lucia 2003. The market prices of project inputs or outputs will NOT

E N D
BENEFIT-COST ANALYSIS financial and economic appraisal using spreadsheets Consumer and Producer Surplus in Benefit-Cost Analysis (Campbell & Brown Chapter 7) Harry Campbell & Richard Brown School of Economics UQ, St. Lucia 2003
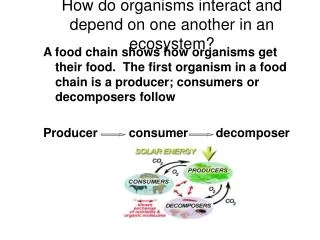
The market prices of project inputs or outputs will NOT change if: - the inputs or outputs are TRADED ie. price is determined in world markets) - the project is SMALL relative to the size of the economy in which is undertaken Examples of project outputs or inputs whose prices might change: - output: a bridge - price of trips across a river - input: wage of skilled labour in a local market eg. ICP case study (Ch.7, p.26)
Suppose the market price of project output is predicted to fall from P0 to P1 as a result of the increase in quantity supplied from Q0 to Q1 (as in Figure 7.1). How do we value the additional output (Q1 - Q0) in a social benefit-cost analysis? Project Analysis: use P1 Private Analysis: use P1 Efficiency Analysis: use (P0+P1)/2 Referent Group Analysis: calculate the aggregate net benefits in the usual way
How do we account for the fall in price of the original quantity of output, Q0? Clearly consumers benefit by the amount (P0 - P1)Q0. When will that represent a net benefit of the project? When the fall in price from P0 to P1 represents a fall in cost, as in the bridge example, the value (P0 - P1)Q0 is a net benefit which is included in the efficiency net benefits. When the fall in price does not represent a fall in cost, one group is better off (consumers) and another group is worse off (firms) by the same amount. The amount (P0 - P1)Q0 is simply a transfer from consumers to firms and it nets out in the efficiency benefit-cost analysis.
Suppose that the fall in product price is not matched by a fall in production cost.What is the effect on aggregate referent group benefits of allowing for the change in output price, compared to the case in which there is no change in price? 1. Suppose that the private firm is not a member of the referent group (as in the ICP case study): efficiency net benefits fall but private net benefits fall even more, hence RG net benefits rise. Consumers benefit at the expense of the firm. 2. Suppose that the private firm is a member of the referent group. Then efficiency net benefits are the same as RG net benefits, and hence RG net benefits fall. The reason for the fall is the lower value placed on the extra output produced by the project.
The social benefit-cost analysis implements the Kaldor- Hicks (K-H) criterion by assessing whether a project is a potential Pareto improvement. A potential Pareto improvement exists if the gainers from a project could compensate the losers and still be better off. Gains and losses are measured as COMPENSATING VARIATIONS. Compensating variations are measured as areas of consumer surplus under demand curves, or as areas of producer surplus above supply curves.
Applying the Kaldor-Hicks criterion: suppose I said that I was going to change the lecture time from 4 pm to 8 am. That would suit some people (the gainers) and not suit others (the losers). To apply the K-H criterion, I ask each gainer to work out how much money I could take away from them and still leave them as well off as before the change. And I ask each loser to work out how much money I would need to pay to them to leave them as well off as before the change. These sums are the compensating variations (CVs). I ask each person to write their CV amount on a piece of paper (positive for gainers, negative for losers). I then pass the hat around: each person puts their piece of paper in the hat and if the net value of the aggregate CV is positive, the change is a potential Pareto improvement.
Effects of a worker training program: On employers: skilled wage rate falls from w0 to w1; benefit is measured by area w0ABw1 On the original skilled labour force: skilled wage rate falls from w0 to w1; cost is measured by area -w0AFw1 On trainees: they get jobs at wage w1 while their opportunity cost is measured by supply curve S1; benefit is area FBG To work out total benefit: add ________ to get total FABG
Value of extra output of food = BCQ1Q0 (Fig. 7.7) Value of extra output = Value of extra income Extra income: 1. Water Authority: P1CQ10 - P0BQ00 2. Landowner: P0BCP1 Total extra income: P1CQ10 - P0BQ00 + P0BCP1 = BCQ1Q0 Conclusion: there are two ways to measure the net benefits of an irrigation project: the output approach and the incomes approach.
Suppose that extra labour is used on the irrigated land. Under the incomes approach this would be reflected in extra value of output. Suppose that the extra labour was hired away from a neighbouring valley. Then there would be an equivalent fall in value of output in that valley. This opportunity cost of labour would have to be subtracted from the value of extra output. If wages rise as a result of competition for labour, labour is better off and employers are worse off - the effect of the wage increase nets out if both are members of the referent group (see Fig. 7.10)
Compensating variation is the sum of money to be taken from (paid to) a gainer (loser) so as to maintain their original level of utility. Hence we measure compensating variation under utility constant demand curves. For a fall in price from P0 to P1 (Fig. A7.1) the CVF = P0AFP1(to be taken from the person) For a rise in price from P1 to P0 (Fig. A7.1) the CVR = P0GCP1 (to be paid to the person) Why is CVR > CVF? Because utility and expenditure are higher on DU1 than on DU0 and hence more compensation is required to maintain them.