Enhancing Satellite-Based Precipitation Estimates with ABI Channels: Part I
10 likes | 135 Views
Explore the use of MODIS and ABI channels for precipitation estimation, comparing single and multi-channel data sets to improve rain/no-rain separation skill scores. Evaluate Tb differences and propose strategies for enhanced precipitation estimates. Discover the physical basis for deriving cloud and precipitation characteristics from brightness temperatures.

Enhancing Satellite-Based Precipitation Estimates with ABI Channels: Part I
E N D
Presentation Transcript
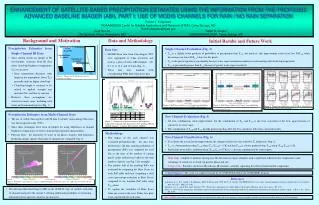
% of Positive SS Positive Skill Negative Skill Cirrus Tb=210 K Mean SS Figure 4. Skill Score (relative to 11.0 µm) for probabilistic rain/no rain separation for several MODIS/ABI channels. Cumulonimbus Tb=200 K Nimbostratus Tb=240 K % of Positive SS 200 250 T (K) Figure 1. Illustration of the IR signal produced by different cloud types. Positive Skill Negative Skill Mean SS Figure 5. Skill Score (relative to 11.0 µm) for probabilistic rain/no rain separation for several combinations of pairs of MODIS/ABI channels. 8.5 µm 12.0 µm 13.2 µm 6.7 µm T12.0 vs. T11.0 T6.8 vs. T11.0 Figure 6. Temperature differences with T11.0 as a function of the SS of the rain/no rain separation. Small T11.0-T12.0thick cloud (Inoue 1985) Relatively warm T6.8rain (Tjemkes et al. 1993) Large T11.0-T12.0cirrus Relatively cold T6.8no rain Figure2. Probability of precipitation as a function of MODIS brightness temperature values: 6.8- and 11.0-µm (left) and 12.0- and 11.0-µm (right). ENHANCEMENT OF SATELLITE-BASED PRECIPITATION ESTIMATES USING THE INFORMATION FROM THE PROPOSED ADVANCED BASELINE IMAGER (ABI), PART I: USE OF MODIS CHANNELS FOR RAIN / NO RAIN SEPARATION Robert J. Kuligowski NOAA/NESDIS Center for Satellite Applications and Research (STAR), Camp Springs, MD Bob.Kuligowski@noaa.gov Jung-Sun Im I.M. Systems Group, Kensington, MD Ralph R. Ferraro NOAA/NESDIS/STAR, Camp Springs, MD Background and Motivation Data and Methodology Initial Results and Future Work • Precipitation Estimates from Single-Channel IR Data • Since raining clouds are opaque at IR wavelengths, estimates from IR data relate cloud-top brightness temperature (Tb) to rain rates: • Since temperature decreases with height in the troposphere, lower Tb’s generally indicate higher cloud tops. • Cloud-top height is assumed to be related to updraft strength and moisture flux, and thus to rain rate. • However, these assumptions are violated in many cases, including cold cirrus and warm nimbostratus (Fig. 1). • Data Sets • MODIS-Terra data from June-August 2005 were aggregated to 2-km resolution and used as a proxy for five ABI channels: 6.8, 8.5, 11.0, 12.3, and 13.2-µm (Fig. 3). • These data were matched with corresponding WSR-88D reflectivity data. • Single-Channel Evaluation (Fig. 4) • T8.5 is a slightly better predictor of probability of precipitation than T11.0 ,but much of this improvement comes from low PoP11.0 values becoming even lower PoP8.5 values for dry pixels. • T6.8 is the poorest predictor, presumably because water vapor attenuation weakens its relationship with cloud-top temperature. • T12.0 is presumably poorer than T11.0 because of greater water vapor sensitivity. • Precipitation Estimates from Multi-Channel Data • The use of visible data together with IR data to identify (non-raining) thin cirrus was first proposed in the 1970’s. • Since then, techniques have been developed for using differences in channel brightness temperatures to derive cloud and precipitation characteristics. • Physical basis: the emissivity of water in all phases changes with frequency, producing unique signals when pairs of channels are compared (Fig. 2). • Two-Channel Evaluation (Fig. 5) • All four combinations show improvement, but the combination of T6.8 and T11.0 is the least consistent of the four, again because of sensitivity to water vapor. • The combination of T11.0 and T13.2 had the greatest median skill, but CO2 sensitivity led to less consistent results. Figure 3. Comparison of spectral response and brightness temperature (standard atmosphere) from corresponding ABI and MODIS channels. (Courtesy Mat Gunshor, CIMSS). • Methodology • The impact of the each channel was evaluated probabilistically: the data were divided into 1-K bins and the probability of precipitation (PoP) was computed for each bin as the ratio of the number of raining pixels (radar reflectivity>5 dBz) to the total number of pixels (see Fig. 3 for example). • The relative skill of the resulting PoPs was evaluated by computing the Brier Score for each PoP table and then computing a skill score (percentage reduction in Brier Score) compared to the baseline PoP table using T11.0 alone. • To capture the variability of Brier Score from one scene to the next, Tukey box plots were constructed for each scene. • Two-Channel Classification (Fig. 6) • To evaluate the reason for the improvement, the change in skill score was related to Tb differences (Fig. 6). • T8.5 is a better predictor than T11.0 when (T8.5-T11.0)>-1.5 K and that T12.0 is a better predictor than T11.0 when (T11.0-T12.0)>-1 K. • Particularly poor skill is exhibited when (T11.0-T6.7)<-35 K (i.e., clear air contaminated by water vapor). • Next step: complete evaluation on longwave IR data and investigate channels with a significant reflected solar component to take advantage of sensitivity to cloud-top particle phase and size. • Longer term: Extend to shortwave IR and near-IR channels, carefully separating the reflected and emitted components. Acknowledgment: This work was supported in part by the GOES-R Risk Reduction (GOES-RRR) program. References Ackerman, S. A., W. L. Smith, J. D. Spinhirne, and H. E. Revercomb, 1990: The 27-28 October 1986 FIRE IFO cirrus case study: Spectral properties of cirrus clouds in the 8-12 m window. Mon. Wea. Rev., 118, 2377-2388. Tjemkes, S. A., L. van de Bert, and J. Schmetz, 1997: Warm water vapor pixels over high clouds as observed by Meteosat. Beitr. Phys. Atmos., 70, 15-21. Inoue, T., 1985: On the temperature and effective emissivity determination of semi-transparent clouds by bi-spectral measurements in the 10 micron window region. J. Meteor. Soc. Japan, 63, 88-99. • The Advanced Baseline Imager (ABI) on the GOES-R series of satellites will offer 16 channels instead of the current 5, offering additional possibilities of extracting information from spectral variations in emissivity. DISCLAIMER: The contents of this poster are solely the opinions of the author and do not constitute a statement of policy, decision, or position on behalf of NOAA or the U.S. Government.