Download
1 / 24
240 likes | 420 Views
Level of Measurement Problems. Sources of Information Sample Problems. Level of measurement - 1. Level of measurement is one of the key determinants for selecting the correct statistic to use.

E N D
Level of Measurement Problems Sources of Information Sample Problems
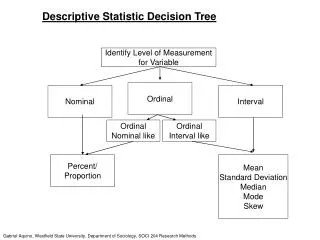
Level of measurement - 1 • Level of measurement is one of the key determinants for selecting the correct statistic to use. • Level of measurement determines whether the numeric data value can be treated as representing a numeric measure of a characteristic, representing the rank or order within the distribution of data values, or is simply a short-hand substitute for a category.
Level of measurement - 2 • If the numeric data value represents a numeric measure of a characteristic, e.g. age, height, GPA, etc., we call it interval level. • If the data value represents the rank or order within the distribution of data values,e.g. level of satisfaction, social class, student status, etc., we call it ordinal level. • If the data value simply represents a short-hand substitute for a category, e.g. sex, race, marital status, etc., we call it nominal level.
Level of measurement - 3 • If a nominal variable has only two categories, we will also refer to it as dichotomous, because there are statistics available for variables that have only two categories. • Sometimes a variable that appears to be interval contains an open-ended category as the first or last category (e.g. 10 and above). We will treat these variables as ordinal, even though it can be argued that the variable is really interval because the number of cases in the open-ended category is very small.
Multiple ways to measure a characteristic • The name or title of a variable is usually not sufficient information to determine level of measurement. • For example, the characteristic of "education" can be measured in multiple ways: • The number of years of education completed • The degree awarded at last graduation • Did or did not attend college • To know how a variable is measured in a data set, we look at the data itself and at the codebook.
Data in the SPSS data editor Data is represented by numbers. Sometimes we may be able to look at a column of data and guess its type, e.g. hrs1 and prestg80 are probably interval level. Most of the time, the numbers will not be an adequate indicator of level of measurement.
The SPSS variable view SPSS includes codebook information in a data set on the tabbed page titled "Variable View." Some of the items in this help us determine level of measurement.
SPSS support for level of measurement SPSS includes a "Measure" column in the "Variable View" as a spot for recording level of measurement, but there is no guarantee that is has been used accurately. In fact, nothing in SPSS data analysis uses the information in this column. In our dataset, the "Measure" column has been deliberately left to the default setting of "Scale,“ though we clearly have variables at other levels of measurement.
Variable labels The variable "Labels" column gives us a better idea of the characteristic that a variable is measuring than does the variable "Name" column, but it is little help in determining level of measurement.
Value labels The "Values" column usually provides us with the best information about level of measurement. Click on the button with the ellipsis on it to open the Value Labels dialog box. The Value Labels Dialog shows the numeric code values that have been entered for a variable and the label that is associated with each code value.
Missing values SPSS also has a column for "Missing" values. Missing values are data values or codes that stand for reasons why a question was not answered with one of the valid choices. Cases with these values will not be included in SPSS calculations. 0 and 9 represent missing data for LABOR FRCE STATUS. The missing value codes are often included in the list of value labels, but we should ignore them when we are determining level of measurement. 0 = NAP is a value label that we should ignore. • Three common missing data indicators in the GSS are: • DK = don’t know • NA = no answer • NAP = not applicable
Value labels and level of measurement • Value labels will usually provide us with enough information to determine the level of measurement. • First, if there are no value labels, the variable is probably interval level (which SPSS calls "Scale"). • Second if there are code labels, the variable is probably nominal or ordinal. To determine which, we study the pattern of the labels and code values.
Nominal versus ordinal • To determine that a variable is ordinal, we look for a pattern that implies a ranking or order, by which each higher code value and label represents more (or less) of the characteristic or trait being measured by the variable. • If all of the labels are ordered in the same direction, the variable is ordinal level. • Ordinal variables may be ranked from low to high or high to low. Either way they are ordinal. • If the labels and codes for a variable do not follow any order, the variable is nominal.
Problem 1 • Based on information in the GSS2000R.Sav data set, the level of measurement of the variable "employment status" [wrkstat] is: • Nominal • Ordinal • Interval • Dichotomous
Solution 1 - A The data values show a narrow range of possible values, which might lead us to suspect that the variable is not interval level.
Solution 1 - B The first two values are ordered by amount of work, but that ordering breaks down when the third category changes to reasons for not working. The value label “0=NAP” stands for missing data: NAP means “not applicable.” The variable is nominal level.
Problem 2 • Based on information in the GSS2000R.Sav data set, the level of measurement of the variable "occupational prestige score" [prestg80] is: • Nominal • Ordinal • Interval • Dichotomous
Solution 2 - A The data values show a wide range of possible values, which might lead us to suspect that the variable is interval level.
Solution 2 - B • The only value labels for any values are associated with missing data: • DK = don’t know • NA = no answer • NAP = not applicable The variable is interval level.
Problem 3 • Based on information in the GSS2000R.Sav data set, the level of measurement of the variable "total family income" [income98] is: • Nominal • Ordinal • Interval • Dichotomous
Solution 3 - A “Income” might lead us to jump to the conclusion that the variable is interval level. The data values show a wide range of possible values, which might lead us to suspect that the variable might be interval level.
Solution 3 - B After the missing data category (NAP which means “not applicable,” the categories appear to be ordinal. If the categories were the same width (e.g. $1000 each), the variable might even be considered interval. However, we note that category 2 is $2000 wide, while categories 3 and 4 are $1000 each. The variable is ordinal level.
Additional information • If additional information about variables in the GSS is needed, try the codebook web site at: http://www.icpsr.umich.edu/GSS/
When in doubt… • There are times when you can narrow the level of measurement down to two categories, and you can make an argument that the variable could legitimately be treated as either level. • In this case, the rule of thumb is to treat the variable at the highest level of measurement that you can justify, i.e. interval rather than ordinal and ordinal rather than nominal. Statistics for higher levels of measurement are more powerful at detecting differences in our data.