Download
1 / 18
180 likes | 243 Views
How Dirty is your Data : The Duality between detecting Events and Faults J. Gupchup A. Terzis R. Burns A. Szalay Department of Computer Science Johns Hopkins University. Outline. Background Problem Statement Experiments Results Discussion. Application.

E N D
How Dirty is your Data : The Duality between detecting Events and Faults J. Gupchup A. Terzis R. Burns A. Szalay Department of Computer Science Johns Hopkins University
Outline • Background • Problem Statement • Experiments • Results • Discussion
Application • Monitoring nesting conditions of the Maryland Box turtles • Science Questions: Do nesting conditions determine sex ? • Important to correlate observations with environmental events (rain, snow etc)
Duality of Faults & Events • Data gathered from Sensor Networks contain faults • Delivering faulty data consumes resources and pollutes statistics • Need for fault detection techniques • Fault Detection methods detect readings that deviate from “normal” or “expected” values • Environmental Events : • Scientifically interesting • Deviate from the norm
Research Question(s) • Are “Events” misclassified as “Faults” ? • What metrics could be used to quantify the misclassification ? • How does the misclassification vary with: • Type of Fault • Type of Fault Detection method • Type of modality (Moisture, Temperature) • Is it possible to design a fault detection mechanism that minimizes the misclassification ?
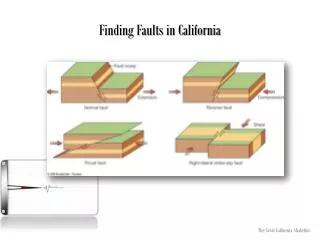
Know Thy Faults • Short Faults • Sudden Change in measurement • Noise Faults • Large variations in amplitude than expected • Little or no variation in amplitude (unresponsive)
Fault Detection Methods • SHORT Rule • If Xi – X(i-1) > δSHORT mark current measurement as fault (point method) δSHORTis established from domain knowledge • NOISE Rule • Take W successive samples • IF (σW ≤ σtrain-σallow) OR (σW ≥ σtrain+σallow), mark all W readings as faulty (block method) • σtrainand σallow are established from training data • Linear Least-square Estimation (LLSE) • Estimate expected value of a sensor’s value using other sensors using LLSE • If Xmodel – Xactual > δLLSE for k of the node’s neighbors, mark the reading as faulty (point method) A. Sharma, L. Golubchik, and R. Govindan, “On the prevalence of sensor faults in real world deployments”, IEEE conference on Sensor, Mesh and Ad Hoc Communications and networks (SECON), 2007
Event Period (Ei) Event Period (Ei) Misclassification Di Di time time Evaluation Metrics • Misclassification error (μ) for Point faults: • μ = event readings tagged as faults / total • event measurements • Misclassification error (μ) for Block Faults: Misclassification Total Misclassification (μ )= ∑i Di / ∑i Ei • Fault detection evaluation metric : False negative ratio = fraction of faults failed to be detected
Jug bay Deployment Map 6 5 2 Weather Station Turtle Nests Courtesy: Google maps 38.784607, -76.700460
Dataset Sensor Data: • Box temperature and soil moisture • 3 motes from Jug Bay (previous slide) • 5 months of data (sampled every 10 min.) • Train Data Set (1 month), Test Data Set (4 months) Event Ground Truth (Weather Data): • Precipitation data collected from a weather station ~ 700 m away (sampled every 15 min.) • 21 major events (i.e. rainfall) occurred • Total rainfall hours : 158 hours
Inject Faults to Establish ground Truth Faults Ground Truth Start with a clean data set
Methodology For Each Fault Detection Method & Each modality • Use 1st month’s data to Train • Obtain Model Parameters • Evaluate Method on Fault-Injected Test Data
Soil Moisture ‘SHORT RULE’ Reducing the number of misclassification errors increases false negatives
Misclassification LLSE method Higher misclassification can occur due to : Spatial & Temporal Heterogeneity of the soil
Lessons Learned • There exists a tension between detecting Events and Faults • Fault Detection Algorithms need to take this into consideration • Events can be misclassified as faults • Need for novel Fault Detection methods that are robust in the presence of Events
Acknowledgements • Abhishek Sharma, Dept. of Computer Science, University of Southern California • Chris Swarth, Jug Bay Wetlands Sanctuary • Life Under Your Feet team • Marcus Chang, University of Copenhagen (Courtesy : Andreas Terzis)