Download
1 / 39
390 likes | 539 Views
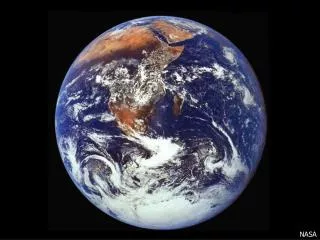
GLOBAL WARMING OR ‘Boy Is It Getting Hot Down Here!’. NASA. Outline. What is Global Warming? What Causes Global Warming? Evidence for Global Warming Predictions of future climates Future directions?. What is Global Warming?.

E N D
Outline • What is Global Warming? • What Causes Global Warming? • Evidence for Global Warming • Predictions of future climates • Future directions?
What is Global Warming? • Global Warming is a result of human activities (anthropogenic) affecting climate in serious and immediate ways - intensifying a natural phenomenon called the “greenhouse effect”. • The result is a long-term rise in the average temperature of the Earth - global warming
What Causes Global Warming? • The burning of fossil fuels releases large quantities of gases such as carbon dioxide CO2 and nitrous oxide into the atmosphere. Decaying garbage in landfills releases methane, another potent gas. • All of these gases prevent the sun’s energy from escaping back into space. • Trapping heat close to the surface of the earth raises global temperatures, turning our world into a planetary greenhouse. • Since the Industrial Revolution, concentrations of these “greenhouse gases” have increased substantially
However, there are those who argue that global warming is not as threatening as it seems. Common arguments from “sceptics” go along these lines: • The greenhouse effect is just a theory. • In the 1970s scientists were predicting an ice age. • The warming is just due to urban heating. • We can’t predict the weather a week in advance, so how can we do it 100 years in advance? • Satellites (and some stations) show no warming. • It’s just natural variability. • The warming is pretty small or unimportant anyway. Hopefully, the following slides, along with your readings and the viewing of ‘An Inconvenient Truth’ will expose some of these fallacies.
Climatologists were aware of threat of global warming, even in the 1970s: “My feeling is that if man’s interferences with the climatic system is uncontrolled for some decades, together with uncontrolled growth of energy use, sooner or later during the next century the warming will overwhelm natural factors which usually produce cooling” H. Flohn, discussion at Monash Univ., December 1975
Numerical modelling…predicts that a 10 per cent increase in the current CO2 concentration would cause a surface temperature increase of about 0.3°C.”Report of a Committee on Climatic Change, Australian Academy of Science, 1976 “ 1976 Academy Report suggests warming of ~0.45°C, if CO2 increased by 15%.
How Do We Know It’s Happening? • Check the thermometer! • The 10 warmest years of the past century occurred after 1980. • There was also an increase in precipitation (rain/snow/hail) in the last century. • These two phenomena - along with a decrease in snow and Arctic ice and a rise in sea level - are all consistent with global warming.
Australian average number of hot days (daily maximum temperature ≥ 35°C), cold days (daily maximum temperature ≤ 15°C), hot nights (daily minimum temperature ≥ 20°C) and cold nights (daily minimum temperature ≤ 5°C) per year. (Nicholls & Collins, 2005)
Australian Alps spring snow depth has declined 40% since 1960, due to warming Nicholls, 2005
A 1000-year record of global average temperatures Temperatures in the last 10 years of the 20th C seemed quite high – but, many record hot summers and years do not global warming make. However, when you compare that last decade, and especially the last few years, with the previous millennium, you get some perspective….based on reconstructed (I.e., proxy) temperatures and actual instrumental data, 1998 was warmer than any other year in the last 1000 years (and this incorporates the probable range of error in proxy measures, illustrated by the yellow curves. Note the proxy measures (the black solid line) tracks the instrumental record – the red line – quite nicely. Also note the general downward trend over the last 1000 years, the “little ice-age” which occurred between ca. 1400 and ca 1850, the steep increase since the start of the industrial revolution, and the decline in temperatures between 1940 and 1970. From Hughes et al 1999.
Retreat of glaciers Grinnell Glacier viewed from the top of Mount Gould during late summer 1938 (left) and 1981 (right), Glacier National Park, Montana. In just 43 years, dramatic climatic response is evident, including loss of volume and formation of the proglacial lake. By 1993, the glacier had shrunk about 63% in area and the terminus had receded about 1.1 km since the end of the Little Ice Age (1850 moraines, right). Grinnell glacier, 1938 Grinnell glacier, 1981
Argentina’s Upsala Glacier was once the biggest in South America, but is now retreating at a rate of 200 metres per year
The Marr Ice Piedmont, a glacier that ends near Palmer Station on the Antarctic Peninsula, crumbles into the sea. Elsewhere on the peninsula, a section of ice shelf larger than the state of Rhode Island broke apart in early 2002. The suspected culprit for such events? Climate warming, which has hit hardest in some of Earth's coldest climes. Average winter temperatures on the Antarctic Peninsula have risen nearly 9°F (5°C) since 1950.
http://video.aol.com/searchresults?query=melting+ice&invocationType=aolvideo-topbox&familyFilter=1http://video.aol.com/searchresults?query=melting+ice&invocationType=aolvideo-topbox&familyFilter=1 Plea over melting Greenland glaciers BBC NEWS (2) + UK Team finds Antartica climate change link BBC News (2) http://video.aol.com/searchresults?query=climate+change&invocationType=aolvideo-topbox&familyFilter=1 Through the eyes of local researchers WBZ News Boston (2) + glaciers threatened by climate change BBC News (7)
Coral reef bleaching Bleaching hot spots in last 15 years Bleached Goniopora coral, Micronesia http://video.aol.com/searchresults?query=coral+reefs&invocationType=aolvideo-topbox&familyFilter=1
Rising sea levels Venezuelan beach (Cata Bay, a 3-hour drive from Caracas)
Rising sea levels This would threaten low-lying islands such as Tuvalu in the Pacific. These images, taken on the same day last year, show the effects of a higher than usual tide. Source: In pictures: How the world is changing. BBC News UK Edition, 16 February 2005. http://news.bbc.co.uk/1/shared/spl/hi/picture_gallery/05/sci_nat_how_the_world_is_changing/html/1.stm
Rising sea levels This is a section of shoreline at Cape Hatteras in North Carolina in the USA, pictured in 1999 and 2004. Rising sea levels are also expected to speed up coastal erosion. http://video.aol.com/searchresults?query=rising+sea+levels&invocationType=aolvideo-topbox&familyFilter=1 Changing climate to reshape UK shore BBC NEWS
Insect pests and disease Tree-eating wood beetles are likely to benefit from a warmer climate and reproduce in ever-increasing numbers. These images show damage to White Spruce trees in Alaska caused by the pests.
Predictions of future climates Now, we change gears to look at a couple of model predictions of future climates. A note: recall that these are predictions from global or regional scale models. These models are generally accurate, and all tend to agree on the sign of the expected change. But, they do differ in degrees (excuse the pun), because they are all parameterized differently. How do they differ? Some models predict substantial global-scale warming, whereas others predict less warming. Some might predict a particular region to warm, whereas another might predict that that same region may cool. However, they all predict warmer tropospheres over the globe during the next century.
Predicted global temperature change 2040-2070 °C In short, this “difference” map shows where and how temperature regimes are predicted to differ relative to mean conditions over the last 30 years. Note that the majority of the globe is predicted to warm, and that warming may be on the order of +8 degrees C (which exceeds the warming that brought us out of the last ice age), although this model makes relatively extreme predictions. The warming predicted for high latitudes (caused by decreases in albedo engendered by reductions in snow cover caused by warming = a positive feedback). (A similar pattern is predicted for Antarctica in the SH winter, but not to the same extent as Arctic regions. Can you figure out why? Note also that continents will warm more than oceans. Source: UK Met Office Web Site
Predicted global precipitation change mm/day In short, this “difference” map shows where and how precipitation regimes are predicted to differ relative to mean conditions over the last 30 years. This model includes deforestation as a driving variable – thus, significant drying is predicted over the Amazon basin (because of clearcutting and loss of transpirational plant tissue). This figure caused quite a stir several years ago, with newspaper headlines that read “Amazon to become a desert!” Interestingly, GCM models predict that for Earth as a whole, precipitation should increase on the order of about 10%. Can you figure out why? Source: UK Met Office
Why Should We Care? • A warmer climate makes moisture evaporate more quickly causing more damaging and costly droughts in some areas and heavier rains in others. • Deadly diseases that exist primarily in warmer climates could spread into other parts of the world.
Why Should We Care? • Communities that border coastal areas would have to relocate houses or spend hundreds of millions of dollars per year on projects to hold back the sea. • Opportunities to enjoy hunting and fishing could dwindle as habitats in certain parts of the country change before the fish and wildlife that live there have a chance to adapt
Why Should We Care? • Variations in water temperature could affect fish populations. • Small temperature fluctuations can make a big difference. In the most recent ice age, annual global temperatures averaged roughly 9 degrees Fahrenheit colder that they are today.
Why Should We Care? Clearly the effects will be: • Environmental • Agricultural • Financial http://video.aol.com/searchresults?query=climate+change&invocationType=aolvideo-topbox&familyFilter=1 (Sky News item – the cost of global warming) • Social • Political • Geographical
Fortunately, Australians DO CARE …on you and on the people of Australia SOURCE: Plummer et al (2005); Dept of Meteorology (Australia)
What can be done? As Al Gore made clear in his lecture there are many actions we can take as individuals and communities (even nations) to limit the more extreme effect. We must reduce CO2 emissions by reducing the use of fossil fuel consumption (the spin-offs politically and economically, as well as environmentally, are enormous). The following slides suggest some alternative fuels.
Sources of Clean Energy • Solar power - harnesses energy from the sun to heat our homes and provide domestic hot water. Q. Why are Japan and Germany (neither noted for their warm weather!) the world leaders in solar power, and why has Australia fallen so far behind in the past decade in investing and developing this alternative source when it has such an abundant supply of sun? • Geothermal power - taps into natural reservoirs of steam and hot water in the earth itself in order to draw them to the surface for use as heat or to generate electricity for home or industrial uses.
Sources of Clean Energy • Biomass - employs crops and trees specifically grown as fuel sources or converts waste products from agricultural crops, forestlands, and municipal solid wastes into liquid and gas fuels for heat or electricity generation. • Wind power - uses modern wind-capturing turbines to generate electricity.
Hopefully, the information you will read/view on global warming might refute some of the sceptics misinformation. As geographers are acutely aware of the interaction of people and the environment this issue is clearly a key issue in the study of geography.
Final thoughts … The evidence is overwhelming that human activity is altering the climate; to what extent and to what end the scientific community may be divided. The question is, should we apply the precautionary principle? Even those with a vested interest in maintaining the status quo are beginning to favour such an approach. “It would be too great a risk to stand by, do nothing, and to wait so long that when the impact on the climate really does begin to be felt we have to collectively take action which is so disruptive that it causes serious damage to the world’s economy”Gerry Hueston, President, BP Australasia, 3 August, 2005.