Download
1 / 47
470 likes | 579 Views
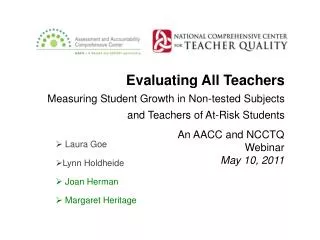
Measuring Teachers’ Contribution to Student Learning Growth: Tested Subjects. Laura Goe, Ph.D. A Workshop Sponsored by SEDL, Southeast Comprehensive Center, and Texas Comprehensive Center. July 27-28 , 2011 New Orleans, LA. Laura Goe, Ph.D. Former teacher in rural & urban schools

E N D
Measuring Teachers’ Contribution to Student Learning Growth: Tested Subjects Laura Goe, Ph.D. A Workshop Sponsored by SEDL, Southeast Comprehensive Center, and Texas Comprehensive Center July 27-28, 2011 New Orleans, LA
Laura Goe, Ph.D. Former teacher in rural & urban schools Special education (7th & 8th grade, Tunica, MS) Language arts (7th grade, Memphis, TN) Graduate of UC Berkeley’s Policy, Organizations, Measurement & Evaluation doctoral program Principal Investigator for the National Comprehensive Center for Teacher Quality Research Scientist in the Performance Research Group at ETS
The National Comprehensive Center for Teacher Quality • A federally-funded partnership whose mission is to help states carry out the teacher quality mandates of ESEA • Vanderbilt University • Learning Point Associates, an affiliate of American Institutes for Research • Educational Testing Service
Trends in teacher evaluation • Policy is way ahead of the research in teacher evaluation measures and models • Though we don’t yet know which model and combination of measures will identify effective teachers, many states and districts are compelled to move forward at a rapid pace • Inclusion of student achievement growth data represents a huge “culture shift” in evaluation • Communication and teacher/administrator participation and buy-in are crucial to ensure the validity of new systems • The implementation challenges are enormous • Few models exist for states and districts to adopt or adapt • Many districts have limited capacity to implement comprehensive systems, and states have limited resources to help them
How did we get here? • Value-added research shows that teachers vary greatly in their contributions to student achievement (Rivkin, Hanushek, & Kain, 2005). • The Widget Effect report (Weisberg et al., 2009) “…examines our pervasive and longstanding failure to recognize and respond to variations in the effectiveness of our teachers.” (from Executive Summary)
Race to the Top definition of effective & highly effective teacher Effective teacher: students achieve acceptable rates (e.g., at least one grade level in an academic year) of student growth (as defined in this notice). States, LEAs, or schools must include multiple measures, provided that teacher effectiveness is evaluated, in significant part, by student growth (as defined in this notice). Supplemental measures may include, for example, multiple observation-based assessments of teacher performance. (pg 7) Highly effective teacher students achieve high rates (e.g., one and one-half grade levels in an academic year) of student growth (as defined in this notice).
Federal priorities (August 2010) • From “Race to the Top” and reiterated in the August 5, 2010 Federal Register (Vol. 75, No. 150) “Secretary’s Priorities for Discretionary Grant Programs” • Teachers should be evaluated using state standardized tests where possible • For non-tested subjects, other measures (including pre- and post-tests) can be used but must be “rigorous and comparable across classrooms” and must be “between two points in time” • Multiple measures should be used, such as multiple classroom evaluations
Multiple measures of teacher effectiveness • Evidence of growth in student learning and competency • Standardized tests, pre/post tests in untested subjects • Student performance (art, music, etc.) • Curriculum-based tests given in a standardized manner • Classroom-based tests such as DIBELS • Evidence of instructional quality • Classroom observations • Lesson plans, assignments, and student work • Student surveys such as Harvard’s Tripod • Evidence binder (next generation of portfolio) • Evidence of professional responsibility • Administrator/supervisor reports, parent surveys • Teacher reflection and self-reports, records of contributions
Achievement Proficient Teacher A: “Success” on Ach. Levels Teacher B: “Failure” on Ach. Levels Start of School Year End of Year Growth vs. Proficiency Models In terms of growth, Teachers A and B areperforming equally Slide courtesy of Doug Harris, Ph.D, University of Wisconsin-Madison
Achievement Proficient Teacher A Teacher B Start of School Year End of Year Growth vs. Proficiency Models (2) A teacher with low-proficiency students can still be high in terms of GROWTH (and vice versa) Slide courtesy of Doug Harris, Ph.D, University of Wisconsin-Madison
Value-added models Many variations on value-added models TVAAS (Sander’s original model) typically uses 3+ years of prior test scores to predict the next score for a student Used since the 1990’s for teachers in Tennessee, but not for high-stakes evaluation purposes Most states and districts that currently use VAMs use the Sanders’ model, also called EVAAS There are other models that use less student data to make predictions Considerable variation in “controls” used 12
A recent description of value-added • “There are various methods for estimating teacher value-added, but all typically entail some variant of subtracting the achievement test scores of a teacher’s students at the beginning of the year from their scores at the end of the year, and making statistical adjustments to account for differences in student learning that might result from student background or school-wide factors outside the teacher’s control.” (Glazerman et al., 2011)
Evidence of teachers’ contribution to student learning growth • Value-added can provide useful evidence of teacher’s contribution to student growth • “It is not a perfect system of measurement, but it can complement observational measures, parent feedback, and personal reflections on teaching far better than any available alternative.” Glazerman et al. (2010) pg 4
Technical considerations: Stability of scores from year to year (1) • “Any practical application of value-added measures should make use of confidence intervals in order to avoid false precision, and should include multiple years of value-added data in combination with other sources of information to increase reliability and validity.” • “Type I and II error rates for comparing a teacher’s performance to the average are likely to be about 25 percent with three years of data and 35 percent with one year of data.” (Schochet& Chiang, 2010, abstract)
Technical considerations: Stability of scores from year to year (2) • Koedel & Betts (2009) suggest using multiple years of data for teacher evaluation to mitigate sorting bias; novice teachers cannot be evaluated under this system • McCaffrey et al. (2009) “…there are significant gains in the stability [of teachers’ value-added scores] obtained by using two-year average performance measures rather than singe-year estimates” (pg. 601)
Technical considerations: Statistical models • Teacher effectiveness scores for a teacher can vary considerably across statistical models. (Newton et al., 2010)
Technical considerations: Scores may vary by content/skills tested (1) Lockwood et al, 2007 • “If this school district were to use Procedures scores to evaluate its middle school mathematics teachers, it would come to conclusions that were substantially different than evaluations based on Problem Solving scores.” (pg. 57) • “This study shows that even subscales of the same test, by the same test developer, can yield different results, as can different weighting among subscales in a composite score.” (pg. 61)
Technical considerations: Scores may vary by content/skills tested (2) • Our results provide a clear example that caution is needed when interpreting estimated teacher effects because there is the potential for teacher performance to depend on the skills that are measured by the achievement tests. (Lockwood et al, 2007, pg. 55)
Technical considerations: Precision of scores “Any practical application of value-added measures should make use of confidence intervals in order to avoid false precision, and should include multiple years of value-added data in combination with other sources of information to increase reliability and validity.” Glazerman et al. (2010) pg 5
Technical considerations: Roster accuracy (1) • To have confidence in results from value-added, we must know that teachers are accurately matched with the students they taught • This is complicated in situations where more than one teacher taught a student in a given year—surprisingly common! • Hock & Isenberg (2011) found that 21% of teachers in one large urban district had students who had also been in another math teacher’s class • They examined various scenarios for getting the most accurate results using value-added
Technical considerations: Roster accuracy (2) • Studies currently underway have shown considerable errors when teachers are asked to verify that they taught particular students • Teachers should be given an opportunity to verify their rosters • The school should verify the number of days a student was in school (and in a teacher’s classroom)
Technical considerations:Student effects (1) • “A teacher who teaches less advantaged students in a given course or year typically receives lower-effectiveness ratings than the same teacher teaching more advantaged students in a different course or year. • Models that fail to take student demographics into account further disadvantage teachers serving large numbers of low-income, limited English proficient, or lower-tracked students.” (Newton et al., 2010, pg 2)
Technical considerations:Student effects (2) • “…[S]tudent characteristics can impact teacher rankings, sometimes dramatically, even when such characteristics have been previously controlled statistically in the value-added model (Newton et al., 2010, pg 2)
Technical considerations:Student effects (3) • Models using different controls for student characteristics do not substantially change results, in spite of huge variation in those characteristics, suggesting that “…value-added methods are living up to their promise of removing the effects of student background variables that are beyond the control of the teachers whose effects we are interested in estimating” (Lockwood et al, 2007, pg 60)
Another popular growth model: Colorado Growth Model • Colorado Growth model • Focuses on “growth to proficiency” • Measures students against “academic peers” • Also called criterion‐referenced growth‐to‐standard models • The student growth percentile is “descriptive” whereas value-added seeks to determine the contribution of a school or teacher to student achievement (Betebenner 2008)
Sample student growth report: Colorado Growth Model Slide courtesy of Damian Betebenner at www.nciea.org
What value-added and growth models cannot tell you • Value-added models are really measuring classroom effects, not teacher effects • Value-added models can’t tell you why a particular teacher’s students are scoring higher than expected • Maybe the teacher is focusing instruction narrowly on test content • Or maybe the teacher is offering a rich, engaging curriculum that fosters deep student learning. • How the teacher is achieving results matters!
Validity • There is little research-based support for the validity of using any measures, including student growth measures, for teacher evaluation • Herman et al. (2011) state, “Validity is a matter of degree (based on the extent to which an evidence-based argument justifies the use of an assessment for a specific purpose).” (pg. 1)
Validity is a process • Starts with defining the criteria and standards you want to measure • Requires judgment about whether the instruments and processes are giving accurate, helpful information about performance • Verify validity by • Comparing results on multiple measures • Multiple time points, multiple raters
New Haven “matrix” Asterisks indicate a mismatch between teacher’s performance on different types of measures
VAMs and other test-based growth models don’t measure most teachers About 69% of teachers (Prince et al., 2006) can’t be accurately assessed with VAMs/growth models Teachers in subject areas that are not tested with annual standardized tests Teachers in grade levels (lower elementary) where no prior test scores are available Questions about the validity of measuring special education teachers and ELL teachers with VAMs
Measuring teachers’ contributions to student learning growth: A summary of current models
Recommendation from NBPTS Task Force (Linn et al., 2011) • Recommendation 2: Employ measures of student learning explicitly aligned with the elements of curriculum for which the teachers are responsible. This recommendation emphasizes the importance of ensuring that teachers are evaluated for what they are teaching.
SLOs + “Ask a Teacher” (Hybrid model) • Concerns about SLOs are 1) rigor, 2) comparability, and 3) administrator burden • A “rigor rubric” helps with first concern • Combining SLOs with aspects of the “Ask A Teacher” model will help with all 3 concerns • Teachers discuss and agree to use particular assessments and measures of student learning growth, ensuring great rigor and comparability • Teachers work together on aspects of scoring which improves validity and comparability and lightens the administrator burden
Rhode Island DOE Model: Framework for Applying Multiple Measures of Student Learning Student learning rating The student learning rating is determined by a combination of different sources of evidence of student learning. These sources fall into three categories: + Professional practice rating Category 1: Student growth on state standardized tests (e.g., NECAP, PARCC) Category 2: Student growth on standardized district-wide tests (e.g., NWEA, AP exams, Stanford-10, ACCESS, etc.) Category 3: Other local school-, administrator-, or teacher-selected measures of student performance + Professional responsibilities rating Final evaluation rating
Considerations (1) • Consider whether data accuracy (rostering is key) and completeness are sufficient for teacher evaluation • Establish “rules and exceptions” such as • How many total and/or consecutive days a student should be on a teacher’s roster to count • How many verified student scores are sufficient for determining a value-added score for a teacher • How to handle missing data (i.e., prior test scores) • Whether to use a single year’s value-added score for teacher evaluation or something like a rolling average • How to count students who have multiple teachers for a tested subject (co-teaching, team teaching, special education/resource, ELL, etc.)
Considerations (2) • Develop a communication strategy to increase awareness and buy-in (FAQs on website, public meetings, news “blasts” to email subscribers • Establish a plan to evaluate measures to determine if they can effectively differentiate among teacher performance • Examine correlations among measures • Evaluate processes and data each year and make needed adjustments • Publish findings of system and measure evaluations
Growth Models Wisconsin’s Value-Added Research Center (VARC) http://varc.wceruw.org/ SAS Education Value-Added Assessment System (EVAAS) http://www.sas.com/govedu/edu/k12/evaas/index.html • Mathematica • http://www.mathematica-mpr.com/education/value_added.asp American Institutes of Research (AIR) http://www.air.org/ Colorado Growth Model www.nciea.org
Evaluation System Models Austin (Student learning objectives with pay-for-performance, group and individual SLOs assess with comprehensive rubric) http://archive.austinisd.org/inside/initiatives/compensation/slos.phtml Delaware Model (Teacher participation in identifying grade/subject measures which then must be approved by state) http://www.doe.k12.de.us/csa/dpasii/student_growth/default.shtml Georgia CLASS Keys (Comprehensive rubric, includes student achievement—see last few pages) System: http://www.gadoe.org/tss_teacher.aspx Rubric: http://www.gadoe.org/DMGetDocument.aspx/CK%20Standards%2010-18-2010.pdf?p=6CC6799F8C1371F6B59CF81E4ECD54E63F615CF1D9441A92E28BFA2A0AB27E3E&Type=D Hillsborough, Florida (Creating assessments/tests for all subjects) http://communication.sdhc.k12.fl.us/empoweringteachers/
Evaluation System Models (cont’d) New Haven, CT (SLO model with strong teacher development component and matrix scoring; see Teacher Evaluation & Development System) http://www.nhps.net/scc/index Rhode Island DOE Model (Student learning objectives combined with teacher observations and professionalism) http://www.ride.ri.gov/assessment/DOCS/Asst.Sups_CurriculumDir.Network/Assnt_Sup_August_24_rev.ppt Teacher Advancement Program (TAP) (Value-added for tested grades only, no info on other subjects/grades, multiple observations for all teachers) http://www.tapsystem.org/ Washington DC IMPACT Guidebooks (Variation in how groups of teachers are measured—50% standardized tests for some groups, 10% other assessments for non-tested subjects and grades) http://www.dc.gov/DCPS/In+the+Classroom/Ensuring+Teacher+Success/IMPACT+(Performance+Assessment)/IMPACT+Guidebooks
References • Betebenner, D. W. (2008). A primer on student growth percentiles. Dover, NH: National Center for the Improvement of Educational Assessment (NCIEA). • http://www.cde.state.co.us/cdedocs/Research/PDF/Aprimeronstudentgrowthpercentiles.pdf • Braun, H., Chudowsky, N., & Koenig, J. A. (2010). Getting value out of value-added: Report of a workshop. Washington, DC: National Academies Press. http://www.nap.edu/catalog.php?record_id=12820 • Glazerman, S., Goldhaber, D., Loeb, S., Raudenbush, S., Staiger, D. O., & Whitehurst, G. J. (2011). Passing muster: Evaluating evaluation systems. Washington, DC: Brown Center on Education Policy at Brookings. • http://www.brookings.edu/reports/2011/0426_evaluating_teachers.aspx# • Glazerman, S., Goldhaber, D., Loeb, S., Raudenbush, S., Staiger, D. O., & Whitehurst, G. J. (2010). Evaluating teachers: The important role of value-added. Washington, DC: Brown Center on Education Policy at Brookings. • http://www.brookings.edu/reports/2010/1117_evaluating_teachers.aspx • Hock, H., & Isenberg, E. (2011). Methods for accounting for co-teaching in value-added models. Princeton, NJ: Mathematica Policy Research. • http://www.aefpweb.org/sites/default/files/webform/Hock-Isenberg%20Co-Teaching%20in%20VAMs.pdf
References (continued) • Kane, T. J., Taylor, E. S., Tyler, J. H., & Wooten, A. L. (2010). Identifying effective classroom practices using student achievement data. Cambridge, MA: National Bureau of Economic Research. • http://www.nber.org/papers/w15803 • Koedel, C., & Betts, J. R. (2009). Does student sorting invalidate value-added models of teacher effectiveness? An extended analysis of the Rothstein critique. Cambridge, MA: National Bureau of Economic Research. • http://economics.missouri.edu/working-papers/2009/WP0902_koedel.pdf • McCaffrey, D., Sass, T. R., Lockwood, J. R., & Mihaly, K. (2009). The intertemporal stability of teacher effect estimates. Education Finance and Policy, 4(4), 572-606. • http://www.mitpressjournals.org/doi/abs/10.1162/edfp.2009.4.4.572 • Linn, R., Bond, L., Darling-Hammond, L., Harris, D., Hess, F., & Shulman, L. (2011). Student learning, student achievement: How do teachers measure up? Arlington, VA: National Board for Professional Teaching Standards. • http://www.nbpts.org/index.cfm?t=downloader.cfm&id=1305 • Lockwood, J. R., McCaffrey, D. F., Hamilton, L. S., Stecher, B. M., Le, V.-N., & Martinez, J. F. (2007). The sensitivity of value-added teacher effect estimates to different mathematics achievement measures. Journal of Educational Measurement, 44(1), 47-67. • http://www.rand.org/pubs/reprints/RP1269.html
References (continued) • Newton, X. A., Darling-Hammond, L., Haertel, E., & Thomas, E. (2010). Value-added modeling of teacher effectiveness: An exploration of stability across models and contexts. Education Policy Analysis Archives, 18(23). • http://epaa.asu.edu/ojs/article/view/810 • Policy Analysis for California Education and Rennie Center for Education Research and Policy (2011). The road ahead for state assessments. Cambridge, MA: Rennie Center for Education Research and Policy. • http://renniecenter.issuelab.org/research/listing/road_ahead_for_state_assessments • Prince, C. D., Schuermann, P. J., Guthrie, J. W., Witham, P. J., Milanowski, A. T., & Thorn, C. A. (2006). The other 69 percent: Fairly rewarding the performance of teachers of non-tested subjects and grades. Washington, DC: U.S. Department of Education, Office of Elementary and Secondary Education. • http://www.cecr.ed.gov/guides/other69Percent.pdf • Race to the Top Application • http://www2.ed.gov/programs/racetothetop/resources.html • Rivkin, S. G., Hanushek, E. A., & Kain, J. F. (2005). Teachers, schools, and academic achievement. Econometrica, 73(2), 417 - 458. • http://www.econ.ucsb.edu/~jon/Econ230C/HanushekRivkin.pdf
References (continued) • Schochet, P. Z., & Chiang, H. S. (2010). Error rates in measuring teacher and school performance based on student test score gains. Washington, DC: National Center for Education Evaluation and Regional Assistance, Institute of Education Sciences, U.S. Department of Education. • http://ies.ed.gov/ncee/pubs/20104004/pdf/20104004.pdf Weisberg, D., Sexton, S., Mulhern, J., & Keeling, D. (2009). The widget effect: Our national failure to acknowledge and act on differences in teacher effectiveness. Brooklyn, NY: The New Teacher Project. http://widgeteffect.org/downloads/TheWidgetEffect.pdf
Laura Goe, Ph.D. 609-734-1076 lgoe@ets.org National Comprehensive Center for Teacher Quality 1100 17th Street NW, Suite 500Washington, DC 20036-4632877-322-8700 > www.tqsource.org