
Teacher Rating and Growth Report Summary for Sandy Beaches High School
This report summarizes the teacher ratings and growth values at Sandy Beaches High School, showcasing the performance of educators against expected growth metrics. The analysis is presented in three different ways based on individual and school-wide growth values. Discover the breakdown of teachers who met, exceeded, or did not meet expected growth, along with insights from applying the 100% and 70/30 rules.

Teacher Rating and Growth Report Summary for Sandy Beaches High School
E N D
Presentation Transcript
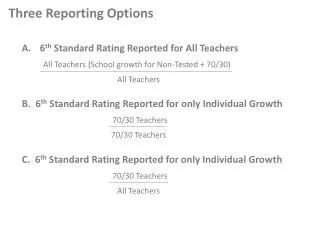
Three Reporting Options 6th Standard Rating Reported for All Teachers All Teachers (School growth for Non-Tested + 70/30) All Teachers B. 6th Standard Rating Reported for only Individual Growth 70/30 Teachers 70/30 Teachers C. 6th Standard Rating Reported for only Individual Growth 70/30 Teachers All Teachers
Evergreen Middle SchoolSchool-wide Growth Value: Exceeded Expected Growth Applying SBE Policy, the results might be represented in the 3 ways: 23 teachers (92%) exceeded expected growth; 2 (8%) meet expected growth 8 teachers (80%) exceeded expected growth; 2 (20%) meet expected growth 8 teachers (32%) exceeded expected growth: 2 (8%) meet expected growth 15 teachershad no individual growth value Applying the 100% Rule 8 teachers individually exceeded expected growth Applying the 70/30 rule 2 teachers did not individually meet expected growth Applying the 70/30 rule
Sandy Beaches High SchoolSchool-wide Growth Value: Did Not Meet Expected Growth 50 teachershad no individual growth value Applying the 100% Rule Applying SBE Policy, the results might be represented in the 3 ways: 70 teachers (93.3%) did not meet expected growth; 5 (6.7%) meet expected growth 20 teachers (80%) did not meet expected growth; 5 (20%) meet expected growth 20 teachers (26.7%) did not meet expected growth: 5 (6.7%) meet expected growth 20 teachers did not individually meet expected growth Applying the 70/30 rule 5 teachers did individually meet expected growth Applying the 70/30 rule