Download
1 / 19
190 likes | 342 Views
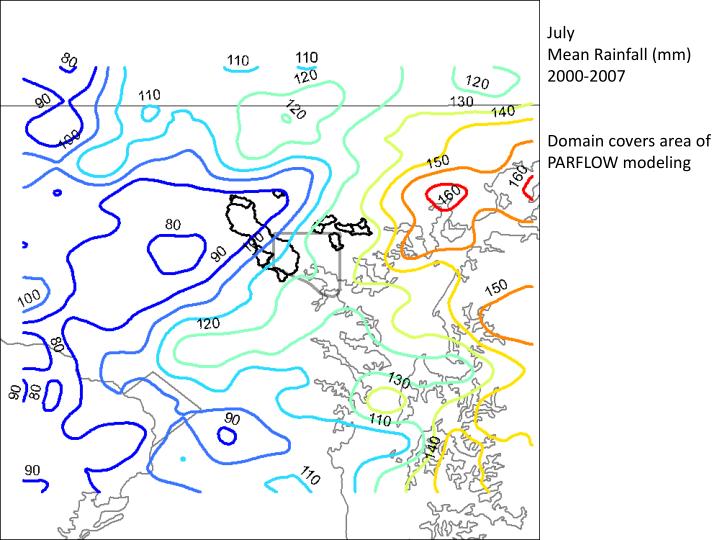
July Mean Rainfall (mm) 2000-2007 Domain covers area of PARFLOW modeling. July Mean Rainfall (mm). Significance levels of tests that mean July rainfall in Box i is different from mean July rainfall in box j. Rain Gage networks used for “bias correction” of radar rainfall fields.

E N D
July Mean Rainfall (mm) 2000-2007 Domain covers area of PARFLOW modeling
July Mean Rainfall (mm) Significance levels of tests that mean July rainfall in Box i is different from mean July rainfall in box j.
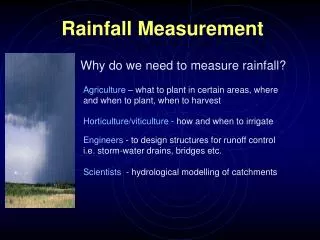
Rain Gage networks used for “bias correction” of radar rainfall fields. Multiplicative bias corrective is carried out on a daily time step (midnight to midnight). QC of rain gages key to quality of the rainfall products.
Scatterplots of daily rainfall from BWI and Metcalf and Eddy Gage 6 and Metcalf and Eddy Gage 2. BWI rain gage was used as a reference in assessing quality of other rain gage observations.
Box plot of the number of 15-minute Hydro-NEXRAD rainfall fields per day by year. Maximum for a day is 96. Availability of Hydro-NEXRAD fields improves over time, with poor availability in 1999. “Stage IV” radar rainfall fields (hourly, 4km, operational products) are used to fill in gaps of missing data. Whiskers are 10 and 90 % values.
Box plots of daily multiplicative bias values for Hydro-NEXRAD rainfall fields. Whiskers give 10 and 90 % values.
Monthly boxplots of multiplicative bias values for Hydro-NEXRAD rainfall fields (top) and Stage IV rainfall fields.
Boxplots of seasonal bias in Hydro-NEXRAD rainfall fields, conditioned on daily mean gage rainfall exceeding 1 mm (top), 5 mm (middle) and 10 mm (bottom).
Intercomparison of hourly bias-corrected Hydro-NEXRAD rainfall fields and rain gage observations from Metcalf-Eddy network.
Basin-averaged rainfall rate (15 minutes) from bias-corrected Hydro-NEXRAD rainfall fields and discharge (1 – 15 minute time interval) from Baisman Run (top left), Moores Run (top right), Upper Gwynns Falls (lower left) and Dead Run (lower right) for June 2006.
March Mean Rainfall (mm) 2000-2007
April Mean Rainfall (mm) 2000-2007
May Mean Rainfall (mm) 2000-2007
June Mean Rainfall (mm) 2000-2007
July Mean Rainfall (mm) 2000-2007
August Mean Rainfall (mm) 2000-2007
September Mean Rainfall (mm) 2000-2007