Establishing Patterns Correlation from Time Lapse Seismic
310 likes | 551 Views
Establishing Patterns Correlation from Time Lapse Seismic. Jianbing Wu [1] , Andre Journel [1] , Tapan Mukerji [2]. [1] Stanford Center for Reservoir Forecasting [2] Stanford Department of Geophysics. Objective. Establish patterns correlation between seismic and water saturation variables

Establishing Patterns Correlation from Time Lapse Seismic
E N D
Presentation Transcript
Establishing Patterns Correlation from Time Lapse Seismic Jianbing Wu[1], Andre Journel[1], Tapan Mukerji[2] [1] Stanford Center for Reservoir Forecasting [2] Stanford Department of Geophysics
Objective • Establish patterns correlation between seismic and water saturation variables • Predict the water saturation field (future work)
Outline • The challenge of 4D seismic • The Stanford V reservoir • Flow simulation • Seismic amplitude simulation • Point-to-point correlation • Pattern correlation • Conclusions and future work
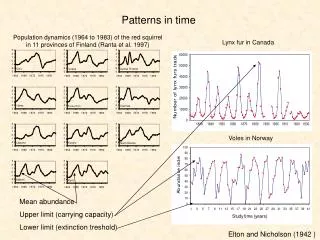
The challenge of 4D seismic • 4D seismic can be used to detect fingering, monitor fluid movement, improve recovery and locate new wells • Success stories are limited to clastic reservoirs, shallow reservoirs, some carbonate reservoirs and reservoirs with great density differentiation • This study aims at establishing correlation between seismic and water saturation variables in intermediary less favorable cases
. . . The challenge of 4D seismic (cont.) Seismic time lapse Water saturation time lapse t1=Jan.1, 2000 t2=Jan.1, 2002 Overall correlation: -0.11 yet excellent visual pattern correlation
producer injector The Stanford V reservoir (Layer 2) Clastic fluvial channels
stratigraphic grid true depth grid Introduction to Stanford V reservoir (cont.)
Reservoir parameters: Oil density 45API0 Pressure 1100psi Temperature 1800F Water viscosity 0.325cP GOR 850scf/STB in sandstone and crevasse in mudstone Initial water saturation: Flow simulation
Flow simulation (cont.) Relative permeability curves: mudstone sandstone & crevasse
Vertical Section at x=20 Oil saturation field on Dec. 29, 2013 (before breakthrough)
Seismic amplitude simulation Normal incidence 1D convolution model with Fresnel zone lateral averaging Seismic amplitude should be able to distinguish velocity difference when saturated with 100% brine vs. 100% oil
Forward simulate seismic amplitude (cont.) Sandstone Crevasse Mudstone
Mudstone Crevasse Sandstone Forward simulate seismic amplitude (cont.) Impedance lithofacies Amplitude Horizontal resolution Fresnel zone: 225m Vertical resolution: 15m Layer 2 mean thickness: 152m Vertical section X=1 Initial ( Jan. 1, 2000)
. . . Point-to-point correlation • Different volume supports Seismic amplitude: Fresnel zone Saturation: grid node • Seismic amplitude shows vertical impedance contrast
Point-to-point correlation (cont.) Colocated correlation between seismic amplitude and a vertical contrast of spatially averaged saturation values. with: total nodes within a moving window
Point-to-point correlation (cont.) seismic amplitude vertical water contrast (Jan. 1, 2000) Overall 3D colocated correlation: -0.20 poor but excellent visual pattern correlation
Spatial pattern correlation Principal component analysis (PCA) Canonical analysis (CA) • Well understood, easy to apply • Linear combinations of data within 3D moving windows • PCA aims at max. within-window variance contribution • CA aims at defining pairs of max. correlated linear combinations
Seismic: only vertical Water saturation: 3D Spatial pattern correlation (cont.) Template sizes:
Spatial pattern correlation (cont.) 3D correlation (space only) : PCA applied to data recorded on Jan. 1, 2000: % within-template variance explained by 1st seismic PC: 84% 1st saturation difference PC: 84% Overall colocated correlation 0.39 PCA repeated on data recorded on Jan.1, 2002: correlation is 0.32 Correlation values improve, but still low!
Spatial pattern correlation (cont.) 4D correlation: PCA and CA performed on time lapse data: time difference of seismic amplitude: time difference of water saturation vertical contrast: with:
. . . 1st PC 1st PC Overall 4D correlation: 0.78 !! Significant Spatial pattern correlation (cont.) t1=Jan.1, 2000 t2=Jan.1, 2004
1st CC 1st CC Overall 4D correlation: 0.82 !! Significant Spatial pattern correlation (cont.) t1=Jan.1, 2000 t2=Jan.1, 2004
4D colocated point-to-point correlation t1=Jan.1, 2000 t2=Jan.1, 2004 Overall 4D correlation: 0.34
Conclusions • Colocated point-to-point correlation between seismic amplitude and water saturation variables is low because of different resolutions • 1st PC and 1st CC can capture the spatial patterns of seismic and saturation time lapse variables • High correlation between PC’s or CC’s can be used towards predicting saturations from time lapse seismic data
Saturation prediction (Future work) • Available data: • Water saturation at well locations (hard) : • Time lapse of seismic amplitude (soft) : • Water saturation at present time obtained from a flow simulator :
Saturation prediction (Future work), cont. • Predict time lapse by regression • from known • Use as an external drift for kriging water • saturation time lapse with • Predict water saturation
amplitude diff. impedance diff. Sw diff. pressure diff. (Mpa) 4 year time lapses of amp, imp, Sw and Pres. at vertical section X=20
Original 1st PC 2nd PC Correlation:0.340.780.55 t1=Jan.1, 2000 t2=Jan.1, 2004