Download
1 / 40
400 likes | 526 Views
Corn Nitrogen Management: Progress in Missouri. Newell R. Kitchen, Kenneth A. Sudduth, and John Hummel USDA-ARS, Columbia, MO Peter Scharf, Harlan Palm, and Kent Shannon Univ. of MO, Columbia, MO. Over the Years. Yield Mapping (1992-1996) Soil EC (1993-1998)

E N D
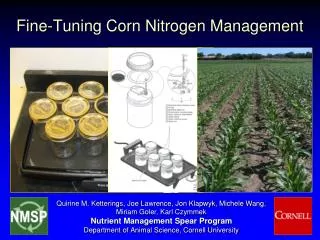
Corn Nitrogen Management: Progress in Missouri Newell R. Kitchen, Kenneth A. Sudduth, and John Hummel USDA-ARS, Columbia, MO Peter Scharf, Harlan Palm, and Kent Shannon Univ. of MO, Columbia, MO
Over the Years • Yield Mapping (1992-1996) • Soil EC (1993-1998) • Ambient Light Radiometers (1997-2002) • Aerial Photos (1999-2001) • Soil Sampling for Inorganic N (1999-2002) • Characterizing Within-Field EONR (1999-2002) • Sensing Technologies for Precision Farming, IFAFS grant (2002-2005)
Adoption is being hindered because of lack of convenience. Peter Nowak, 7th Int. Conf. on Precision Agriculture, July 26, 2004
Outline • Sub-Field Economic Optimal N Rate • Plant-Specific N Application in Corn • Field Testing of VR N Applicator Using Active Light Sensors
Sub-field Economic Optimal N Rate • 3 soil types: Mississippi delta, loess, claypan • 3 years: 2000-2002 • Producers’ fields • Treatments were field-length strips of discrete N rates from 0 to 280 kg N ha-1 in 56-kg increments. • Plots were six rows wide (4.5 m) and ranged in length from 400 to 1000 m. • Corn grain was harvested from the center four rows of each plot using a combine equipped with a yield monitor and corn population sensors
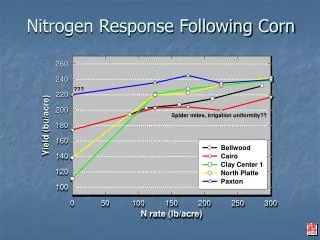
Oran00 Rep1 Block6 16 12 Yield (Mg ha-1) 8 Nopt 4 0 0 100 200 300 300 100 200 N rate (kg ha-1) Oran00 Rep3 Block26 16 12 8 Nopt Yield (Mg ha-1) 4 0 0 N rate (kg ha-1) Deriving Spatially Variable Economic Optimum N Rate
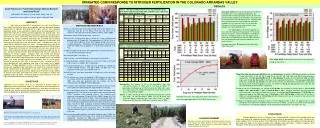
whisker: range box: 25th to 75th percentile box line: median plus sign : mean asterisk: N rate based on mass balance and actual field-average yield
The Take Home • EONR is highly variable within Missouri corn fields, and between fields • EONR is highly-dependent on yearly climate conditions • Yield is not a very poor predictor of EONR
Plant-Specific N Application in Corn • Field studies have shown increased corn yield with better plant uniformity, which generally was measured by plant-spacing standard deviation (Krall et al., 1977; Nielson, 1991; Doerge et al., 2002). • The variability of plant spacing is primarily caused by one of the following: • skips due to either un-dropped seeds or non-emerged seedlings, • double, triple or more plants, where two or more seeds take the place of one, • misplaced plants, shifted from its designated location towards one of the within-row neighbors
Objective • To evaluate the agronomic response of corn plants to varying N fertilizer rate on a plant-by-plant basis in conjunction with plant spacing scenarios.
Nitrogen Treatments • No N • Adequate N, 269 kg N ha-1 shortly after emergence • Treatments at or about V8 growth stage • Equal N, 179 kg N ha-1 • VR1 “Robin Hood”, …179-224-134-134-224-179…. kg N ha-1 for UN, SS, and DS and …179-134-224-134-179…kg N ha-1 for DP (treated as one plant) • VR2 “Sheriff of Nottingham”, …179-134-224-224-134-179…kg N ha-1 for UN, SS, and DS and …179-224-134-224-179… kg N ha-1 for DP
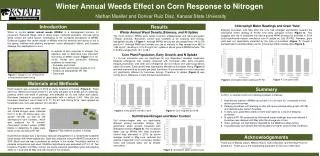
a b c d Uniform Single Skip Double Skip Double Irrigated Site 2003
a ab b b c Adequate Equal VR 1 VR 2 No N Irrigated Site 2003
Procedures • Seven producer fields as research sites • UAN + Agrotain for all N treatments • Reference N strips were applied shortly after emergence • VR and CR treatments were done at knee/waist-high corn, and also shoulder-high corn at two sites • 6-row treatment strips, sensors over row 2 and 5 and averaged for calculations • Algorithm used was developed based on radiometer measurements taken from small plot studies from 1998-99 (unpublished) • Sites include 16-m long response plots to be hand harvested
Algorithm for Knee- to Waist-High Corn - Ceiling for Reference set to 0.25
Algorithm for Shoulder-High Corn - Ceiling for Reference set to 0.25
Reference Strips Ratio
Research supported in part by the USDA- NRI and IFAFS Grant Programs. Assistance also given by OSU, NTech, and Holland Instruments.