Closed-Form Supervised Dimensionality Reduction with Generalized Linear Models
Closed-Form Supervised Dimensionality Reduction with Generalized Linear Models. Irina Rish Genady Grabarnik IBM Watson Research, Yorktown Heights, NY, USA Guillermo Cecchi Francisco Pereira Princeton University, Princeton, NJ, USA

Closed-Form Supervised Dimensionality Reduction with Generalized Linear Models
E N D
Presentation Transcript
Closed-Form Supervised Dimensionality Reduction with Generalized Linear Models Irina Rish Genady Grabarnik IBM Watson Research, Yorktown Heights, NY, USA Guillermo Cecchi Francisco Pereira Princeton University, Princeton, NJ, USA Geoffrey J. Gordon Carnegie Mellon University, Pittsburgh, PA, USA
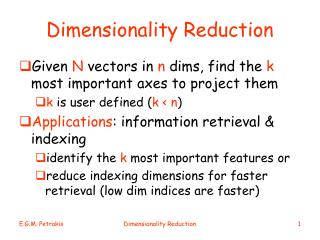
Outline • Why Supervised Dimensionality Reduction (SDR)? • General Framework for SDR • Simple and Efficient Algorithm • Empirical Results • Conclusions
Motivating Application: Brain Imaging (Functional MRI) • Acquires sequence of MRI images of brain activity by measuring changes in blood oxygenation level • High-dimensional, small-sample real-valued data: • 10,000 to 100,000 of variables (voxels) • 100s of samples (time points) • Learning tasks: • Predicting mental states: • is a person looking at a face or a building? • Is a person listening to a French or a Korean sentence? • how angry (happy, sad, anxious) is a person? • Extracting patterns of a mental disease (e.g. schizophrenia, depression) • Predicting brain activity given stimuli (e.g., words) • Issues:Overfitting? Interpretability? fMRI slicing image courtesy of fMRI Research Center @ Columbia University fMRI activation image and time-course - Courtesy of Steve Smith, FMRIB
Other High-Dimensional Applications • Network connectivity data (sensor nets, peer-to-peer, Internet) • Collaborative prediction (rankings) • Microarray data • Text Example: peer-to-peer interaction data (IBM downloadGrid: content distribution system) 10913 clients 2746 servers Variety of data types: real-valued, binary, nominal, non-negative A general dimensionality-reduction framework?
Why Dimensionality Reduction? • Visualization • Noise reduction • Interpretability (component analysis) • Regularization to prevent overfitting • Computational complexity reduction Numerous examples: PCA, ICA, LDA, NMF, ePCA, logistic PCA, etc. Image courtesy of V. D. Calhoun and T. Adali, "Unmixing fMRI with independent component analysis“, Engineering in Medicine and Biology Magazine, IEEE, March-April 2006.
Why SUPERVISED Dimensionality Reduction (SDR)? PCA LDA In supervised case (data points with class labels), standard dimensionality reduction such as PCA may result into bad discriminative performance, while supervised dimensionality reduction such as Fisher’s Linear Discriminant Analysis (LDA) may be able to separate the data perfectly (although one may need to extend LDA beyond 1D-projections)
SDR: A General Framework … Y1 YK • there is an inherent low-dimensionalstructure in the data that is predictive about the class • Both data and labels are high-dimensional stochastic functions over that shared structure (e.g., PCA = linear Gaussian model) • We use Generalized Linear Models that assume exponential-family noise (Gaussian, Bernoulli, multinomial, exponential, etc) U1 … UL X1 … XD • Our goal: • Learn a predictor U->Y simultaneously with reducing dimensionality (learning X->U) • Hypothesis: • Supervised DR works better than unsupervised DR followed by learning a predictor
Related Work : Particular X U and U Y 1. F. Pereira and G. Gordon. The Support Vector Decomposition Machine,ICML-06. Real-valued X, discrete Y (linear map from X to U, SVM for Y(U) ) 2. E. Xing, A. Ng, M. Jordan, and S. Russell. Distance metric learning with application to clustering with side information, NIPS-02. 3. K. Weinberger, J. Blitzer and L. Saul. Distance Metric Learning for Large Margin Nearest Neighbor Classification, NIPS-05. Real-valued X, discrete Y (linear map from X to U, nearest-neighbor Y(U)) 4. K. Weinberger and G. Tesauro. Metric Learning for Kernel Regression, AISTATS-07. Real-valued X, real-valued Y (linear map from X to U, kernel regression Y(U)) 5. Sajama and A. Orlitsky. Supervised Dimensionality Reduction using Mixture Models, ICML-05. Multi-type X (exp.family), discrete Y (modeled as mixture of exp-family distributions) 6. M. Collins, S. Dasgupta and R. Schapire. A generalization of PCA to the exponential family, NIPS-01. 7. A. Schein, L. Saul and L. Ungar. A generalized linear model for PCA of binary data, AISTATS-03 Unsupervised dimensionality reduction beyond Gaussian data (nonlinear GLM mappings)
Our Contributions • General SDR framework that handles • mixed data types (continuous and discrete) • linear and nonlinear mappings produced by Generalized Linear Models • multiple label types (classification and regression) • multitask learning (multiple prediction problems at once) • semi-supervised learning, arbitrary missing labels • Simple closed-form iterative update rules; no need for optimization performed at each iteration; guaranteed convergence (to local minimum) • Currently available for any combinations of Gaussian, Bernoulli and multinomial variables (i.e., linear, logistic, and multinomial logistic regression models)
SDR Model: Exponential-Family Distributions with Low-Dimensional Natural Parameters U1,…,UL V1 Wk W1 VD … … Y1 YK X1 XD X1 XD Y1 YK
Another View: GLMs with Shared ``Hidden Data’’ U V1 Wk VD W1 … … X1 XD Y1 YK
Optimization via Auxiliary Functions w* w2 w1 w0 w
Auxiliary Functions for SDR-GLM Gaussian log-likelihood: auxiliary function coincides with the objective function Bernoulli log-likelihood: use bound on logistic function from [Jaakkola and Jordan (1997)] Multinomial log-likelihood: similar bound recently derived by [Bouchard, 2007]
Key Idea: Combining Auxiliary Functions Stack together (known) auxiliary functions for X and Y:
Empirical Evaluation on Simulated Data • Generate a separable 2-D dataset U (NxL, L=2) • Assume unit basis vectors (rows of 2xD matrix V) • Compute natural parameters • Generate exponential-family D-dimensional data X
Bernoulli Noise • SDR greatly outperforms unsupervised DR (logistic PCA) + SVM or logistic regression • Using proper data model (e.g., Bernoulli-SDR for binary data) really matters • SDR ``gets’’ the structure (0% error), SVM does not (20% error)
Gaussian Noise • SDR greatly outperforms unsupervised DR (linear PCA) + SVM or logistic regression • For Gaussian data, SDR and SVM are comparable • Both SDR and SVM outperforming SVDM (quadratic loss + hinge loss)
Regularization Parameter (Weight on Data Reconstruction Loss) • Empirical trend: lowest errors achieved for relatively low values (0.1 and less) • Putting too much weight on reconstruction loss immediately worsens the performance • In all experiments, we use cross-validation to choose best regularization parameter
Real-life Data: Sensor Network Connectivity Binary data, Classification Task 41 light sensors (nodes), 41 x 41 connectivity matrix Given 40 columns, predict 41st (N=41, D=40, K=1) Latent dimensionality L = 2, 4, 6, 8, 10 • Bernoulli-SDR uses only 10 out of 41 dimensions to achieve 12% error (vs 17% by SVM) • Unsupervised DR followed by classifier is inferior to supervised DR • Again, appropriate data model (Bernoulli) outperforms less appropriate (Gaussian)
Real-life Data: Mental state prediction from fMRI Real-valued data, Classification Task Predict the type of word (tools or buildings) the subject is seeing 84 samples (words presented to a subject), 14043 dimensions (voxels) Latent dimensionality L = 5, 10, 15, 20, 25 • Gaussian-SDR achieves overall best performance • SDR matches SVM’s performance using only 5 dimensions, while SVDM needs 15 • SDR greatly outperforms unsupervised DR followed by learning a classifier • Optimal regularization parameter: 0.0001 for SDR, 0.001 for SVDM
Real-life Data: PBAIC 2007 fMRI dataset 17 minutes Real-valued data, Regression Task • 3 subjects playing a virtual-reality videogame, 3 times (runs) each • fMRI data: 704 time points (TRs) and 30,000 voxels • Runs rated on 24 continuous measurements (target variables to predict) • Annoyance, Anxiety, Presence of a danger (barking dog), Looking at a face, Hearing Instructions, etc. • Goal: train on two runs, predict target variables given fMRI for 3rd run ( ``is subject listening to Instructions”?) SDR-regression was competitive with the state-of-art Elastic Net sparse regression for predicting “Instructions”, and outperformed EN in low-dimensional regime
Conclusions • General SDR-GLM framework that handles • mixed data types (continuous and discrete) • linear and nonlinear mappings produced by Generalized Linear Models • multiple label types (classification and regression) • multitask learning (multiple prediction problems at once) • semi-supervised learning, arbitrary missing labels • Our model: features and labels = GLMs over shared ``hidden’’ low-dim data • i.e., exponential-family distributions with low-dimensional natural parameters • Simple closed-form iterative algorithm • uses auxiliary functions (bounds) with easily-computed derivatives • short Matlab code, no need for optimization packages • runs fast (e.g., compared with SVDM version based on Sedumi) • Future work • Is there a general way to derive bounds (aux. functions) for arbitrary exp-family log-likelihood? (beyond Gaussian, Bernoulli and multinomial) • Combining various other DR methods (e.g., NMF) that also allow for closed-form updates • Evaluating SDR-GLM on multi-task and semi-supervised problems (e.g., PBAIC) • Extensions to sparse GLMs
More Results on Real-life Data: Classification Tasks Internet connectivity (PlanetLab) data (binary) Mass-spectrometry (protein ‘expression levels’)
Principal Component Analysis (PCA) PCA finds an orthogonal linear transformation that maps the data to a new coordinate system such that the greatest variance by any projection of the data comes to lie on the first coordinate (called the first principal component), the second greatest variance on the second coordinate, and so on. PCA is theoretically the optimum transform for a given data in least square terms.
Probabilistic View of PCA Traditional view at PCA as a least-squares error minimization: When is fixed, this is equivalent to likelihood maximization with Gaussian model: Thus, traditional PCA effectively assumes Gaussian distribution of the data Maximizing Gaussian likelihood finding minimum Euclidean distance projections