Transparency 1
Transparency 1. Click the mouse button or press the Space Bar to display the answers. Splash Screen. Example 1-3b. Objective. Organize and interpret data in a frequency table. Example 1-3b. Vocabulary. Statistics. Collecting, organizing, and interpreting data. Example 1-3b. Vocabulary.


Transparency 1
E N D
Presentation Transcript
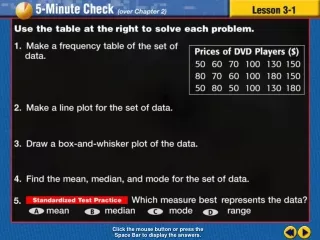
Transparency 1 Click the mouse button or press the Space Bar to display the answers.
Example 1-3b Objective Organize and interpret data in a frequency table
Example 1-3b Vocabulary Statistics Collecting, organizing, and interpreting data
Example 1-3b Vocabulary Data Pieces of information
Example 1-3b Vocabulary Frequency Table Shows the number of pieces of data that fall within given intervals
Example 1-3b Vocabulary Scale The set of all possible values of a given measurement, including the least and greatest numbers in the set, separated by the intervals used
Example 1-3b Vocabulary Interval Separates the scale into equal parts
Example 1-3b Vocabulary Tally mark Counters used to record items in a group
Lesson 1 Contents Example 1Make a Frequency Table Example 2Make and Use a Frequency Table Example 3Interpret Data
Winning Scores 20 34 23 34 31 35 27 49 30 52 37 20 55 20 42 39 46 38 38 27 Source: superbowl.com Example 1-1a FOOTBALL Winning Super Bowl scores from 1983 to 2002 are listed below. Make a frequency table of the data. You need a ruler! Make a frequency table with at least 6 rows using the lines on your paper 1/3
Winning Scores 20 34 23 34 31 35 27 49 30 52 37 20 55 20 42 39 46 38 38 27 Source: superbowl.com Example 1-1a FOOTBALL Winning Super Bowl scores from 1983 to 2002 are listed below. Make a frequency table of the data. A frequency table needs 3 columns Leave the top row with no columns for the title 1/3
Winning Scores 20 34 23 34 31 35 27 49 30 52 37 20 55 20 42 39 46 38 38 27 Source: superbowl.com Example 1-1a Winning Scores Frequency Scores Tally Add Title Add headings to chart The data in the first column which is “scores” The second column is labeled “tally” The third column is “frequency” 1/3
Winning Scores 20 34 23 34 31 35 27 49 30 52 37 20 55 20 42 39 46 38 38 27 Source: superbowl.com Example 1-1a Winning Scores Frequency Scores Tally Choose an appropriate scale and interval for the data Determine the smallest number Determine the largest number 1/3
Winning Scores 20 34 23 34 31 35 27 49 30 52 37 20 55 20 42 39 46 38 38 27 Source: superbowl.com Example 1-1a Winning Scores Frequency Scores Tally 20-29 30-39 40-49 50-59 The interval must be the same on each row Since the smallest number is 20 use 20-29 for the first interval The interval is 10 so add 10 to each number to make a new interval 1/3
Winning Scores 20 34 23 34 31 35 27 49 30 52 37 20 55 20 42 39 46 38 38 27 Source: superbowl.com Example 1-1a Winning Scores Frequency Scores Tally 20-29 I 30-39 I I 40-49 I 50-59 I Make a tally mark for each number 20 is in the group of 20-29 31 is in the group of 30-39 30 is in the group of 30-39 55 is in the group of 50-59 46 is in the group of 40-49 1/3
Winning Scores 20 34 23 34 31 35 27 49 30 52 37 20 55 20 42 39 46 38 38 27 Source: superbowl.com Example 1-1a Winning Scores Frequency Scores Tally 20-29 I I 30-39 I I I I 40-49 I 50-59 I I 34 is in the group of 30-39 On the 5th tally put a diagonal across the other 4 tally marks 35 is in the group of 30-39 52 is in the group of 50-59 20 is in the group of 20-29 38 is in the group of 30-39 1/3
Winning Scores 20 34 23 34 31 35 27 49 30 52 37 20 55 20 42 39 46 38 38 27 Source: superbowl.com Example 1-1a Winning Scores Frequency Scores Tally 20-29 I I I I 30-39 I I I I I I 40-49 I I 50-59 I I 23 is in the group of 20-29 27 is in the group of 20-29 37 is in the group of 30-39 42 is in the group of 40-49 38 is in the group of 30-39 1/3
Winning Scores 20 34 23 34 31 35 27 49 30 52 37 20 55 20 42 39 46 38 38 27 Source: superbowl.com Example 1-1a Winning Scores Frequency Scores Tally 20-29 I I I I I 30-39 I I I I I I I I 40-49 I I I 50-59 I I 34 is in the group of 30-39 49 is in the group of 40-49 20 is in the group of 20-29 39 is in the group of 30-39 27 is in the group of 20-29 1/3
Winning Scores 20 34 23 34 31 35 27 49 30 52 37 20 55 20 42 39 46 38 38 27 Source: superbowl.com Example 1-1a Answer: Winning Scores Frequency Scores Tally 20-29 6 I I I I I 30-39 9 I I I I I I I I 40-49 I I I 3 50-59 2 I I Count the tally marks and put the number in the frequency column 1/3
Example 1-1b TEMPERATURE The daily high temperatures for the last two weeks of August in Cleveland, Ohio are listed below. Make a frequency table of the data. 1/3
Points Tally Frequency 60-69 I 1 70-79 IIII 4 80-89 IIII II 7 90-99 II 2 Example 1-1b Answer: High Temperature (F0) 1/3
Favorite Types of Music P R F P F F R F P P F P F C P C J R R F J R P P F R=rock, J=jazz, C=country, F=top 40, P=rap Example 1-2a MUSICKaley asked her classmates about their favorite types of music. The results are shown in the table. Make a frequency table of the data. Then determine the favorite and least favorite types of music. There are 5 categories Make a frequency table with 7 rows using the lines on your paper 2/3
Example 1-2a A frequency table needs 3 columns Leave the top row with no columns for the title 2/3
Favorite Types of Music P R F P F F R F P P F P F C P C J R R F J R P P F R=rock, J=jazz, C=country, F=top 40, P=rap Example 1-2a Favorite Types of Music Frequency Type of Music Tally Add Title Add headings to chart The data in the first column which is “type of music” The second column is labeled “tally” The third column is “frequency” 2/3
Favorite Types of Music P R F P F F R F P P F P F C P C J R R F J R P P F R=rock, J=jazz, C=country, F=top 40, P=rap Example 1-2a Favorite Types of Music Frequency Type of Music Tally Rock (R) Jazz (J) Country (C) Top 40 (F) Rap (P) When there are letters there is no need for intervals Write in the categories - DO NOT abbreviate, then put the symbol in parenthesis 2/3
Favorite Types of Music P R F P F F R F P P F P F C P C J R R F J R P P F R=rock, J=jazz, C=country, F=top 40, P=rap Example 1-2a Favorite Types of Music Frequency Type of Music Tally Rock (R) Jazz (J) I Country (C) I Top 40 (F) I I I Rap (P) Mark a tally mark for each letter 2/3
Favorite Types of Music P R F P F F R F P P F P F C P C J R R F J R P P F R=rock, J=jazz, C=country, F=top 40, P=rap Example 1-2a Favorite Types of Music Frequency Type of Music Tally Rock (R) I I I Jazz (J) I I Country (C) I Top 40 (F) I I I Rap (P) I 2/3
Favorite Types of Music P R F P F F R F P P F P F C P C J R R F J R P P F R=rock, J=jazz, C=country, F=top 40, P=rap Example 1-2a Favorite Types of Music Frequency Type of Music Tally Rock (R) I I I I Jazz (J) I I Country (C) I Top 40 (F) I I I I I Rap (P) I I 2/3
Favorite Types of Music P R F P F F R F P P F P F C P C J R R F J R P P F R=rock, J=jazz, C=country, F=top 40, P=rap Example 1-2a Favorite Types of Music Frequency Type of Music Tally Rock (R) I I I I Jazz (J) I I Country (C) I I Top 40 (F) I I I I I Rap (P) I I I I 2/3
Favorite Types of Music P R F P F F R F P P F P F C P C J R R F J R P P F R=rock, J=jazz, C=country, F=top 40, P=rap Example 1-2a Favorite Types of Music Frequency Type of Music Tally Rock (R) I I I I Jazz (J) I I Country (C) I I Top 40 (F) I I I I I I I I Rap (P) I I I I I I 2/3
Favorite Types of Music P R F P F F R F P P F P F C P C J R R F J R P P F R=rock, J=jazz, C=country, F=top 40, P=rap Example 1-2a Favorite Types of Music Frequency Type of Music Tally 5 Rock (R) I I I I 2 Jazz (J) I I 2 Country (C) I I 8 Top 40 (F) I I I I I I I 8 I Rap (P) I I I I I I Count the tally marks and put the number in the frequency column 2/3
Example 1-2a Then determine the favorite and least favorite types of music. Answer: Favorite Types of Music Favorite will have the most frequency Frequency Type of Music Tally 5 Rock (R) I I I I There are 2 favorites Top 40 and Rap 2 Jazz (J) I I 2 Country (C) I I Least favorite will have the least frequency 8 Top 40 (F) I I I I I I I 8 I Rap (P) I I I I I I There are 2 least favorites Jazz and Country Favorite - Top 40 and Rap Least Favorite - Jazz and Country 2/3
Favorite Colors Y R B P L P Y R L Y R P B Y R Y P Y B Y Y=yellow, R=red, B=blue, P=pink, L=purple Example 1-2b COLORSSamantha asked her classmates about their favorite colors. The results are shown in the table. Make a frequency table of the data. Then determine the favorite and least favorite colors. 2/3
Color Tally Frequency yellow IIII II 7 red IIII 4 blue III 3 pink IIII 4 purple II 2 Example 1-2b Answer: Favorite Color Favorite - yellow Least favorite - purple 2/3
Temp (F) Tally Frequency 100–105 IIII 5 106–111 IIII IIII II 12 112–117 IIII IIII IIII I 16 118–123 IIII IIII IIII 14 124–129 II 2 130–135 I 1 Example 1-3a TEMPERATUREThe frequency table shows the record high temperatures reported by each state of the United States. How many states have reported temperatures above 111? above The key is “above” 1110 Record High Temperatures in US Add the frequency of all temperatures above 1110 Answer: 33 states 3/3
Weight Tally Frequency 70-79 III 3 80-89 IIII 5 90-99 IIII II 7 100-109 IIII III 8 110-119 IIII 4 120-129 I 1 Example 1-3b * WEIGHTThe frequency table shows the results of a survey of the weights of boys in a seventh grade class. How many of the boys weigh less than 100 pounds? 7th Grade Boys Weight Answer: 15 3/3
End of Lesson 1 Assignment