Download
1 / 51
520 likes | 737 Views
Persistent organic pollutants - sample analysis Jana Klánová. klanova @ recetox.muni.cz. 1. Environmental analytical chemistry Specific features, general scheme 2. Sampling Sampling plan , strategy, sampling protocol, sample size and quality, transport , storage 3. Sample preparation

E N D
Persistent organic pollutants - sample analysis Jana Klánová klanova@recetox.muni.cz
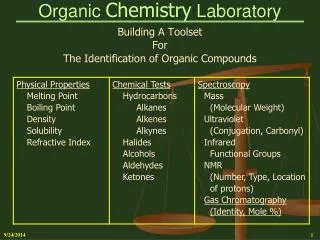
1. Environmental analytical chemistry Specific features, general scheme 2. Sampling Sampling plan, strategy, sampling protocol, sample size and quality, transport, storage 3. Sample preparation Extraction of solid (Soxhlet, automatic extraction, MAE, ASE, SFE) and liquid (L-L, SPE, SPME, head-space) samples, fractionation and clean-up (column chromatography, gel permeation) 4. Analytical techniques Chromatographic techniques, principals, instrumentation,HPLC, GC, GC-MS 5. Persistent organic pollutants Priority pollutants (PCBs, PCDDs/Fs, PAHs, pesticides), emerging pollutants (SCCPs/MCCPs, antibiotics, degradation products) 6. QA/QC Calibration, limit of detection and quantification, internal and recovery standards, blanks, certified reference materials, interlaboratory calibration tests,method validation and verification, GLP
Environmental science brings together scientists from many fields to perform complex studies of various environmental compartments, processes, and interactions. • They may include: • - water and food quality monitoring • - level of contamination of environmental compartments • - ozone depletition as a result of the presence of certain chemicals in the atmosphere • regional contamination studies • evaluation of the impact of local sources of pollution • - toxicity of chemical compounds as a function of their chemical structure • impact of chemical substances on living organisms • - bioavailability • bioaccumulation • - biotic and abiotic transformations • - transport of pollutants in the environment • global fate of pollutants • - international directives and their impact on the global contamination • remediation actions and their quality control • sustainable development • Most of them involve the chemical analysis as one of necessary steps.
Environmental analytical chemistry chalenges: • international conventions focus attention on the new groups of pollutants • old contamination brings the problem of residue analyses • lowering limits as well as environmental levels require low detection limits • large-scale monitoring is crutial for the studies of the long-range transport • development of new sampling techniques is encouraged • increasing number of samples stresses the need for automatization • fate studies require understanding of distribution processes and equilibria • photochemical reaction complicate the sampling and data interpretation • consideration of both, analytical and toxicological data is important • for successful risk assessment • methods of biochemistry and molecular-biology are often implemented in • toxicological studies • - international studies require standardization of all procedures
There are several steps necessary for • environmental contamination control: • - problem definition • screening of the situation, data interpretation • evaluation of the extent of the problem • selection of the best procedure to monitor the situation • evaluation of the present state and future development • exposure evaluation and risk assessment • suggestion of correcting measures or remediation activities • new directives to control the situation • monitoring designed to evaluate effectiveness of measures
Specific problems of environmental analysis • low homogenity of samples (soil) • low stability of samples (biota) • various matrices (methods for extraction of analytes from matrices) • wide range of analytes (method development) • wide range of concentration (robust methods) • monitoring on the levels close to the detection limits (high deviations) • - risk of secondary contamination • price of ultra-trace analysis (instrumentation, chemicals, standards)
General scheme of environmental analysis • Sampling - homogenization • - conservation • - transport • - storage • Sample preparation - extraction • - clean-up • - selective elution • - concentration • - derivatization • - Sample analysis • - Data interpretation
Sampling – documentation required • sampling plan (a goal, selection of sampling sites, analytes, sampling method, • number of samples, sampling period and frequency, safety procedures), • seeks the balance between the value of data and its price • standard operational procedure for sampling various matrices (sampling devices, • steps involved in collecting of representative sample -homogenous, of reasonable • size and stability, quality of transport and storage) • sampling protocols (name and number of the sample, sampling site, matrix, • date of sampling, local conditions and measurements, methods, sample size, • responsible person)
Sampling site 1. DEZA GPS: 49°29’48’’ 17°57’14’’ 245 m Local conditions:
Particles Gas Glass Fiber Filter GFF Polyurethane Foam Filter PUF Sampling Techniques Particulate Phase Gas Phase Air Pump High-Volume sampler
Passive sampling Can environmental concentrations of pollutantsbe calculated from the analyte levels accumulated in an integrative passive sampler? • - Calibration conditions should approximate field conditions - Performance Reference Compounds
Calibration of a passive samplerin a flow-through system Chemicals in MeOH Water reservoir overhead stirrer Samplers waste water Analytes In MeOH Water Stirrer Peristaltic pump 30 ml/min Peristaltic pump 100 l/min Exposure tank B. Vrana, R. Greenwood, G. Mills
Sampling rates of PAHs B. Vrana, R. Greenwood, G. Mills
Performance reference compounds PRCs are non-interfering compounds added to the sampler priorto exposure. They are usedfor in situ calibrationapproach, where the rate of PRC loss during an exposure is related to the target compound uptake. This is accomplished by measuring PRC loss ratesduring calibration studies and field exposures.
PRC = D10-Biphenyl Temperature = 11°C Use of performance reference compounds B. Vrana, R. Greenwood, G. Mills
Preparation of the sample before extraction • Soil samples • lyofilization or air-drying • sieving (< 2mm) and homogenization • appropriate storage (protected from sunlight, heat and humidity) • Sediment samples • - stone and water removal, lyofilization or air-drying • grating and sieving (<63um), homogenization • powder copper treatment for sulphur removal • Plant samples • lyofilization or air-drying • grating, homogenization • Animal samples • lyofilization or • homogenization of a wet sample with sodium sulphate
Extraction and clean-up • The goal: transfer of analytes to the chemical phase suitable for analysis, • removal of interferences and pre-concentration of the sample. • Extraction techniques: • solvent extraction (Soxhlet, automatic Soxtec, MAE, ASE, SFE) • liquid-liquid extraction • - solid phase extraction and microextraction (SPE, SPME) • - semipermeable membrane separation • head space analysis • Clean-up techniques • sulphuric acid treatment • column liquid chromatography (silica gel, alumina, florisil) • - gel permeation chromatography
Air samples • filters from high volume samplers or passive samplers are extracted as solid samples • (Soxhlet, MAE, ASE, SFE) • Water samples • direct analysis of the samples with high concentration of pollutants • head space, SPE, L-L • Soil and sediment samples • Soxhlet, MAE, ASE, SFE • powder copper treatment for the sulphur removal in sediment samples • Biotic samples • high molecular compounds removal by gel permeation chromatography and column • chromatography
Presence Availability Activity Total mass Fraction of total mass Measure that drives diffusion and partitioning How much is there? How much is available for ... ? How high is the diffusive pressure into other media? Exhaustive Extraction Depletive Extraction/ Sampling Equilibrium Sampling Devices P. Mayer, F. Reichenberg
Supercritical Fluid Extraction (SFE) High pressure CO2(100 to 400 bar, 40 to 150 oC) is pumped through asample, and extracted analytes are collected in a suitable solvent for GC analysis. Why to use supercritical carbon dioxide? - CO2 is a lipophilic solvent much like biological lipids in polarity - PAH solubilities in CO2 are proportional to those in water, but ca. 104 higher - pressure and temperature gradients enable the extraction of both, non-polar and polar compounds - mild SFE can be used to predict bioavailability of compounds
Earthworm Mortality Depends on Available PAHs (measured by SFE), not on Total PAH Concentrations Soil Total PAH Available Available Total Mortality (ug/g soil) Fraction (SFE) PAH (ug/g C) % Mortality CG15 1020 0.25 1040 0 OG14 168 0.46 2720 0 CG11 15600 0.06 3280 0 CG12 3790 0.16 7880 0 OG17 17200 0.27 9720 0 OG5 1870 0.41 11100 0 OG10 42100 0.33 16300 0 CG3 4100 0.83 45700 100 OG18 17300 0.74 50100 100 S. B. Hawthorne, C. B. Grabanski, D. J. Miller
Silica Silica + H2SO4 Silica Silica + NaOH Silica Silica + AgNO3 Flow chart of a clean-up procedure for stack emission samples Sampling train Sampling standards Basic Alumina Super I column Rinsing of sampling device Active carbon column Extraction standards Concentration Extraction Syringe standards GC/MS Concentration A. Kočan, Slovak Medical University
Priority pollutants • polychlorinated biphenyls • polychlorinated dibenzo-p-dioxins and furans • organochlorinated pesticides and their metabolites • polyaromatic hydrocarbons • aromatics and nitro-aromatics • chlorinated benzenes • fenol and chlorinated fenols • halogenated alkans
Polychlorinated biphenyls • sulphuric acid treatment • silica gel column chromatography • activated carbon for non-ortho PCBs • - GC-ECD, GC-MS, GC- HRMS
Organochlorinated pesticides (DDT, HCH, hexachlorobenzene, toxaphene, aldrin, dieldrin, endrin, endosulfane, chlordane) • for HCHs and DDTs analytical procedures similar • to PCBs • GC-ECD, GC-MS, NCI-MS, HRMS HCH p,p’-DDT p,p’-DDD p,p’-DDE • analytical procedures similar to PCBs for toxaphene, • sulphuric acid has to be omitted for aldrin or endosulfane • GC-MS, NCI-MS, HRMS
Polychlorinated dibenzodioxins and dibenzofurans • combined modified silica gel clean-up • fractionation on alumina/florisil column • non-ortho PCBs separation on activated carbon column • HRGC-HRMS • - kapilary columns 50-60m (DB-5, DB-17, DB-DIOXIN) • - EI, NCI • - SIM • MS-MS • Polyaromatic hydrocarbons • silica gel column chromatography • GC-MS, FLD-HPLC
Sample analysis Chromatographic separation (GC, HPLC) is the most common technique for the analysis of environmental samples. It is a physical method based on the distribution of compounds between two phases (stationary and mobile). Process of continuous sorption and desorption of compounds in contact with the stationary phase is responsible for different migration times and for separation of analytes. Two dimensional (GC-GC) and two modal (HPLC-GC) chromatography provide even more sofisticated tools for environmental analysis GC-MS, HPLC-MS and HRMS enable the trace and ultra-trace analysis
out of splitless injector to mass spectrometer GC separation: • Non-polar stationary phase (e.g. DB-5) – used for the samples of animal origin and higher chlorinated congeners • Polar phase (e.g. SP-2330) – used for environmental samples (good separation but shorter lifetime) • Splitless, on-column or large-volume injection • Direct connection of the column to the ion source A. Kočan, Slovak Medical University
Sample Introduction Data Output Inlet • GC • LC • Direct inlet Data System • Magnetic-sector • Quadrupole • Ion trap • Time-of-flight • Ion-cyclotron resonance • Electron multiplier • Photomultiplier • Microchannel plate • Electron impact (EI) • Chemical ionization (CI) • Electrospray (ESI) • Fast-atom bombardment (FAB) • Laser ionization (LIMS) • Resonance ionization (RIMS) • ˇThermal ionization (TIMS) • Plasma-desorption ionization (PD) • Matrix-assisted laser desorption ionization (MALDI) Ionization, separation of ions and their detection take place in vacuum (~ 10-4 – 10-6 Pa) Vacuum Pumps Mass Spectrometer • All the MS systems compose of the following parts: Ion Source Mass Analyzer Ion Detector A. Kočan, Slovak Medical University
~70 Volts Electron Collector (Trap) Positive Ions + Neutral Molecules Inlet _ _ Repeller to Analyzer + + + + + + + e- e- e- _ Electrons Filament Extraction Plate Electron Impact Ionization Source 10 to 20 eV out of those 70 eV are transferred to the molecules during the ionization process; Since ~ 10 eV are enough to ionize most organic molecules the excess energy leads to extensive fragmentation; Hence EI is classified as a „hard“ ionization technique The fragmentation gives structural information A. Kočan, Slovak Medical University
resonant ion non-resonant ion • Consists of 4 parallel metal rods. • Two opposite rods have an applied potential combined from DC and AC voltages. _ Detector + + • The voltages affect the trajectory of ions traveling down the flight path centered between the rods. _ • For given dc and ac voltages, only ions of a certain mass-to-charge ratio pass through the filter and all other ions are thrown out of their original path. Ion Source DC and AC Voltages Quadrupole Mass Filter • A mass spectrum is obtained by monitoring the ions passing through the quadrupole filter as the voltages or frequency on the rods are varied. A. Kočan, Slovak Medical University
The ion-trap analyzer consists of 3 electrodes with hyperbolic surfaces to trap ions in a small volume – the central ring electrode and 2 adjacent endcap electrodes. A mass spectrum is obtained by changing the electrode voltages to eject the ions from the trap. Wolfgang Paul 1989 Nobel Price for Physics „for the development of the ion trap technique“ Ion Trap Mass Spectrometry • The advantages of the ion-trap mass spectrometer include compact size, and the ability to trap and accumulate ions to increase the signal-to-noise ratio of a measurement. • This technique can be used easily in the MS/MS (MSn) mode A. Kočan, Slovak Medical University
Time-Of-Flight Mass Spectrometry (TOFMS) • It uses differences in transit time through a drift region to separate ions of different masses • An electric field accelerates all ions into a field-free drift region with the same initial kinetic energy for all the ions produced • It operates in a pulsed mode so ions must be produced or extracted in pulses • Since the ion kinetic energy is 0.5mv2, lighter ions have a higher velocity than heavier ions and reach the detector sooner (e.g., ions of m/z 500 arrive in ~ 15 ms and m/z 50 in ~ 4.6 ms • By TOF-MS, up to 50000 full spectra can be measured in a second • Since full spectra are available, peak deconvolution software enabling to differentiate non-separated GC peaks may be applied • The TOF ultra-fast scanning is suitable for fast GC where peak widths can be much less then a second A. Kočan, Slovak Medical University
ion trajectory in register ion trajectory not in register (too light) S Detector Ion Source N ion trajectory not in register (too heavy) Electromagnet Magnetic Sector Mass Analyzer A. Kočan, Slovak Medical University
What is the SCAN Mode in Mass Spectrometry ? • Thescanningmode provides mass spectra.They are recorded (scanned) at regular intervals (typically 0.5 – 1 /s; much faster if TOFMS is used) during the GC separation and stored in the instrument data system for subsequent qualitative or quantitative evaluation. • From mass spectra, it is often possible to deduce structural features (mass spectral interpretation) but this requires experience and can be very time-consuming, particularly as a complex mixture might contain hundreds of components. • The spectra can also be compared with those stored in mass spectral libraries. Although library searching is a very useful and timesaving technique, it is important to remember that such searches do not identify compounds – analysts do! A. Kočan, Slovak Medical University
2,3,7,8-TCDD 13C12-2,3,7,8-TCDD M+. A=1392 (82%) M+. A=1936 (80%) m/z 319.9 m/z 331.9 [M+2]+. A=1688 (100 %) [M+2]+. A=2415 (100%) m/z 321.9 m/z 333.9 HRMS/LRMS-SIM chromatogram from the analysis of 2378-TCDD in a soil extract by the isotope dilution method [M+4]+. A=829 (49%) [M+4]+. A=1198 (50%) m/z 323.9 m/z 335.9 What is the SIM (or MID) Mode in Mass Spectrometry ? • SIM (Selected Ion Monitoring) or MID (Multiple Ion Detection) is much more sensitive technique suitable for trace quantitative analysis. Here, instead of scanning a whole spectrum, only a few ions (generally, the most abundant but characteristic selected from the mass spectrum) are detected during the GC run. • This can result in as much as a 500-fold increase in sensitivity, at the expense of selectivity. Depending on the analyte, low picogram to even low femtogram amounts can be measured using this powerful technique. • Stable isotope-labeled internal standards can be employed. A. Kočan, Slovak Medical University
In general, more ions have the same nominal mass • For example, to separate these 2 ions we need a resolution of 5124 • To distinguish between them certain MS resolution is needed R = 122 /(122.060585 – 122.036776) = 5 124 A. Kočan, Slovak Medical University
Conversion of Analytical Results into the Toxic Equivalent (TEQ) • This conversion is based on the assumption that all the 2,3,7,8-substituted PCDDs and PCDFs (17 cong.), as well as the dioxin-like PCBs (12 cong.), bind to the same receptor, the Ah receptor, and show comparable qualitative (toxic) effects, but with different potencies • These differences in toxicity are expressed in the toxic equivalency factors (TEFs) • TEF of the most toxic 2378-TCDD = 1 TEQ = (PCDDi × TEFi) + (PCDFi × TEFi ) + (PCBi × TEFi ) A. Kočan, Slovak Medical University
Quality assurance/quality control (QA/QC) • Quality assurance • Preventive measures (quality of facilities, personnel and education, equipment and service, calibration, internal and recovery standards) • Quality control • Control measures (internal – blank and reference material analyses, external – interlaboratory comparison, audit) • Reasons • repeatibility of measurements • comparison of results between laboratories • political and economical importance of results
Terminology Calibration Limit of detection and quantification Sensitivity and specificity Accuracy, trueness, precision Method validation and verification Internal standards Recovery and surrogate recovery standards Certified reference materials interlaboratory calibration tests, GLP
Standard operational procedure • General information (terminology, principles, range of use, limitations, • safety • procedures, toxicology, waste treatment) • Directives • Consumables and chemicals (glass, standards, solvents, reference materials) • Equipment (sampling and analytical equipment, service) • Calibration (standards, procedures) • Analytical scheme (method validation and verification) • Quality control (internal - blank, reference material, external – • intercalibration) • Data interpretation • Annexes