Download
1 / 25
250 likes | 381 Views
Space-Time Datasets in Arc Hydro II. by Steve Grise (ESRI), David Maidment, Ernest To, Clark Siler (CRWR). Space-Time Datasets. CUAHSI Observations Data Model. Sensor and laboratory databases. From Robert Vertessy, CSIRO, Australia. a. a. a. a. a. a. b. b. b. b. b. b. c. c. c.

E N D
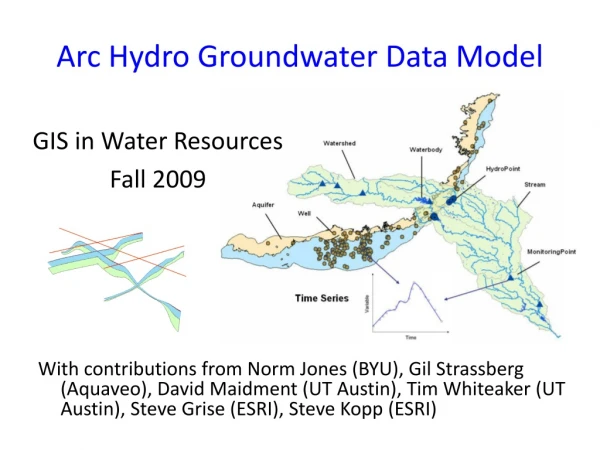
Space-Time Datasets in Arc Hydro II by Steve Grise (ESRI), David Maidment, Ernest To, Clark Siler (CRWR)
Space-Time Datasets CUAHSI Observations Data Model Sensor and laboratory databases From Robert Vertessy, CSIRO, Australia
a a a a a a b b b b b b c c c c c c x, y, z x, y, z x, y, z x, y, z x, y, z x, y, z Space-Time Dataset • A set of records with • Time • Location • 1 or more variables variables time
a a a a a a a a a a a a a b b b b b b b b b b b b b c c c c c c c c c c c c c Example: River Flow • For surface water resources, stream gages have a fixed location with continuous measurements over time • Variables related to stream flow are the most common measurements • Data is typically measured regularly and continuously, but there are often gaps due to device errors or routine maintenance • There are also cases of overflow or dry conditions where the values are outside of the range of measurement for the device stream flow river height variables mean velocity time Data gap fixed x, y, z An overflow condition could be recorded simply as > 500 cubic feet/second
a a a a a b b b b b c c c c c Example: Water Quality • For water quality, sampling sites have a fixed location with intermittent measurements over time • Four times per year is typical • There is a sampling “event”, and a large number of chemical species are produced through laboratory analysis of water samples • Data has metadata that specifies what laboratory procedure was used • Some data require a qualifier to be properly interpreted like “<“ to indicate a measurement that is below a detection limit • Data are “Time stamped” with the time that the sampling event began. They are considered “instantaneous data” observed at that time. turbidity nitrate variables conductivity time t1 t3 t2 t5 t4 fixed x, y, z water quality sample
Display of data that vary in latitude, longitude, depth and time (Ernest To)
Data Structure for a single variable These data are extracted from CUAHSI ODM, and Offset = Depth in this instance
a a a a a a a a b b b b b b b b c c c c c c c c x, y, z x, y, z x, y, z x, y, z x, y, z x, y, z x, y, z x, y, z Example: Water Reservoir • For water reservoirs, data is recorded for the water level of the reservoir, along with all inflows and outflows • A flow time series dataset describes the information required to do a water balance on the reservoir contents • “Flow variables” apply over the entire time interval; “state variables” apply at instants of time at beginning and end of interval; • Typically there are derived datasets • Monthly data compiled from daily data • Annual data from monthly data • Data are recorded regularly through time inflow outflow variables Precip storage time Inflow Evap Storage Outflow
a a a a a a a a b b b b b b b b c c c c c c c c x, y, z x, y, z x, y, z x, y, z x, y, z x, y, z x, y, z x, y, z Example: Water Rights Analysis • A water resources simulation model is run for monthly time steps for ~50 years and it computes ~40 variables related to water supply reliability • Water rights diversion points, • Reservoirs, and • Other “control points” on the stream system • Each model “run” generates millions of data values. • The “data cube” is completely filled in because it is all computed • Information products needed are graphs of variables at points, maps of feature conditions at a single time point, and maps of averages through a defined time interval of feature conditions (i.e. dataset derived “on the fly”) % of time reliability % of volume reliability variables modeled point features flow time Study area (watershed)
Maps and Charts Plot a graph for a space point Plot a map for a time point Space Time A set of variables ……
a a a a a a a a b b b b b b b b t c c c c c c c c t x, y, z x, y, z x, y, z x, y, z x, y, z x, y, z x, y, z x, y, z t t t t t t Example: Climate and Weather • Observations that come from weather balloons and other measuring devices have dynamic location properties • For weather and climate forecast datasets, each data point represents an area with consistent atmospheric characteristics • For weather observations, a large amount of data comes from fixed stations so the datasets are similar to stream gage datasets temperature air pressure variables relative humidity time forecast data balloon trajectory
a a a b c c c x, y, z x, y, z x, y, z x, y, z x, y, z x, y, z x, y, z x, y, z x, y, z x, y, z Example: Species Observations • In this type of dataset, observers are frequently moving along a path such as a hiking trail or a boat cruise • Multiple species may be observed, and even the lack of information is significant • Data is often recorded using offsets from the observer location a variables a species group “a” a species group “b” c species group “c” time c c b
Other Datasets • There are many types of Time Series Datasets • Observations • Samples • Model results • Remote sensing data/imaging • Concepts are useful for many communities • Science • Business • Statistics • Planning • Health • Transportation
Space-Time Datasets:Implementation Concepts • The general pattern can be described as • Time Series Values • The data • Time Series Descriptions • The metadata • There are a number of ways to store and manage this information in a computer system
Example: Arc Hydro Version 1 Implementation • Approach works well for an individual project with stream gage and other surface water data • Constrained to 1 variable per time step • Limited in its ability to handle location • Changes in x, y, z over time • i.e., Marine and species observation datasets have an additional “cruise” or “observation” concepts linking multiple features • FeatureID provided some flexibility, but did not directly support unique identity for features at different time steps • In general, implementation patterns for the feature portion of the data model were not explored/explained • Different spatial representations • Raster data • Multidimensional data • GIS Layers and their properties were considered but not explained • Inefficient approach with multiple variables
Arc Hydro Version 2Improvements • GIS Layer and representation focus • Use of Metadata • Improved Efficiency • More documented implementation patterns • General Time Series Dataset concepts applicable to many communities
Representations in GIS • Time series data can be represented in different ways • Charts and graphs • Modeling simulations • Surfaces • Rasters • Vector feature classes • GIS Layers provide a convenient set of representation types for different views into Time Series Datasets
Layers • Layers represent data • Layer Properties • Queries • Representation types • Display/styles • Variable(s) • Labels • Layers deal with presentation of data, and they are closely linked to the data storage model
Metadata • Each Time Series Dataset is a complex structure, and there are many patterns • Metadata is a tool that can be used to document datasets • Facilitates search and discovery • Aids in sharing and re-use of data • Standards-based metadata/cataloging methods are available • In practice, once users understand the dataset, they tend to work with the Time Series Values and rarely re-visit the metadata in applications • Shift in Arc Hydro II to use of FGDC/ISO metadata to document datasets and variables • For the grey boxes in the diagram shown here
Improved Efficiency • In Arc Hydro 1, we tried to put all time series values into a single table • This implied creating rows for each variable, or adding additional columns/TSValues rows to datasets • Since it was table-based, it did not include feature and raster representations, which required additional processing steps • By promoting multiple datasets with a flexible approach for managing variables, data management activities will be improved, especially for larger datasets Single Time Series Table with 1 variable Time Series Datasets with multiple variables
Improved Efficiency • For display, layers are built using Time Series Datasets • Typically we “Select” or “Slice” 1 variable for presentation • Layers can be built from source Values using InMemory layers, or built from Time Series Datasets Time Series Datasets with variable(s) Time Series Layers with variable(s)
Implementation Patterns • Patterns will be explained for different types of implementations • Small/single project • Workgroup or multi-project environments • Very large datasets • Different spatial representation options • … • One key difference is that there will be multiple datasets – basically one dataset per set of time series values • Different dataset names and storage strategies • Documented with metadata
a a a a a a b b b b b b c c c c c c x, y, z x, y, z x, y, z x, y, z x, y, z x, y, z A General Spatial-Temporal Model • A Space-Time Dataset is a set of records with • Time • Location • 1 or more variables variables time