Optimal Production Schedule and Profit Analysis for Docking Stations
Explore a linear programming example to determine the optimal production schedule and weekly profit for a manufacturer producing three styles of docking stations. Learn about shadow prices, reduced costs, and ranges of optimality and feasibility.

Optimal Production Schedule and Profit Analysis for Docking Stations
E N D
Presentation Transcript
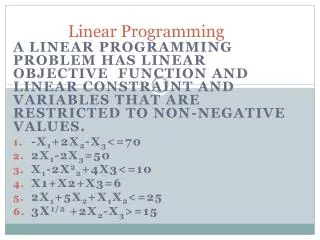
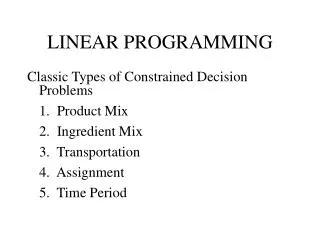
Linear Programming Example 4 Determining Objective Function Coefficients Interpretation of Shadow Prices Interpretation of Reduced Costs Ranges of Optimality/Feasibility
The Problem A manufacturer of docking stations for computers can make three different styles from laminated wood. • Each docking station requires 2 slide assemblies. • Screws, braces and other hardware required to produce the docking stations are in abundant supply and will not affect production. • Each week it can assign up to 6 workers working 8 hours per day, 5 days a week for production – sunk cost. • Each week it can purchase up to • 7500 sq. ft. of the laminated wood for $0.20 per sq. ft. • 4500 slide assemblies for $0.40 each Station Wood Labor Cost of Selling Model Required Required Hardware Price SL 1 4 sq. ft 4.8 min. $0.75 $11.35 CP 6 3 sq. ft. 6.6 min. $0.90 $12.30 JR 8 2.5 sq. ft. 7.2 min. $1.10 $14.40
Questions • What is the optimal production schedule and weekly profit? • If 150 extra slide assemblies became available, what is the most you would be willing to pay for them? • If a half-time worker could be added to the labor force, what is the most we would be willing to pay him. • If an additional full-time worker were added why would the shadow prices change? • What is the minimum selling price for the CP 6 model that would justify its production? • Within what range of values for the net profit of JR 8’s will the optimal solution remains the same?
Decision Variables/Objective • Net Weekly Unit Profit • (Selling Price) – (Hardware Cost) • (Slide Cost) – (Wood Cost) X1 = # SL 1’s produced weekly X2 = # CP 6’s produced weekly X3 = # JR 8’s produced weekly $11.35 - .75 – 2(.40) – 4(.20) = $9.00 $12.30 - .90 – 2(.40) – 3(.20) = $10.00 $14.40 - 1.10 – 2(.40) – 2.5(.20) = $12.00 MAX Total Expected Weekly Return MAX Total Expected Weekly Return MAX 9X1 + 10X2 + 12X3
Constraints Feet of wood used Cannot Exceed 7500 • Cannot use more than 7500 feet of wood • Cannot use more than 4500 slide assem. • Cannot use more than (6 workers)x(8hr/day) x(5 days/week)x(60min/hr) = 14,400 min 7500 4X1 + 3X2 + 2.5X3 ≤ Slide Assemblies Used Cannot Exceed 4500 4500 2X1 + 2X2 + 2X3 ≤ Minutes Used Cannot Exceed 14400 14400 4.8X1 + 6.6X2 + 7.2X3 ≤
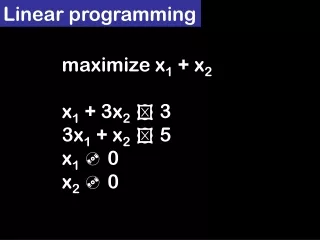
Complete Model MAX 9 X1 + 10 X2 + 12X3 s.t. 4 X1 + 3 X2 + 2.5X3≤ 7500 2 X1 + 2 X2 + 2X3 ≤ 4500 4.8X1 + 6.6X2 + 7.2X3 ≤ 14400 All X’s ≥ 0
=C5-C6-C7-C8 Drag across =.2*C11 Drag across =SUMPRODUCT($C$3:$E$3,C10:E10) Drag down
What is the optimal production schedule and weekly profit? • Sl 1’s • 0 CP 6’s • 1500 JR 8’5 $24,750 Weekly Profit
If 150 extra slide assemblies became available, what is the most you would be willing to pay for them? 150 is within the Allowable Increase Shadow price = 1.5 Slide assemblies are included costs. Value Per Unit = Original Price + Shadow Price = .40 +1.50 = 1.90 150 units Worth 150(1.90) = $285
If a half-time worker could be added to the labor force, what is the most we would be willing to pay him. Shadow price = 1.25 1200 is within the Allowable Increase ½ time worker works (4)(5)(60) =1200 minutes per week 1200 minutes Worth 1200(1.25) = $1500 Labor is a sunk cost.
2400 is outside the Allowable Increase If an additional full-time worker were added why would the shadow prices change? Full time worker works (8)(5)(60) =2400 minutes per week Thus the shadow prices will change.
Reduced Cost = -1.25 Profit and hence the selling price would have to improve by $1.25 What is the minimum selling price for the CP 6 model that would justify its production? Thus selling price must rise to $12.30 + 1.25 = $13.55
Range of Optimality 12 – 1.67 12 + 1.50 $10.33 $13.50 Within what range of values for the net profit of JR 8’s will the optimal solution remains the same?
Review • How to calculate “net” objective function coefficients. • How to interpret the shadow price of an included cost. • How to interpret a shadow price of a sunk cost. • How to interpret a reduced cost. • How to use a range of feasibility. • How to use a range of optimality.