Download

1 / 35
350 likes | 481 Views
In this comprehensive guide, we will explore essential Excel functionalities including freezing rows and columns, printing large datasets, and effectively designing and managing tables. Learn how to create structured tables that enable advanced data management and apply various table styles. We'll also delve into sorting and filtering data and utilizing PivotTables for data summarization. Master techniques for creating calculated fields, formatting PivotTables, and managing conditional formatting to enhance data visualization in your projects.

E N D
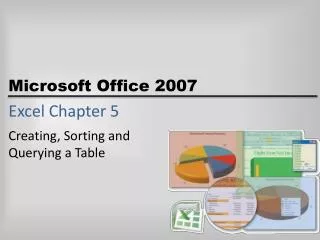
Day 9:Excel Chapter 5 Tazin AfrinTazin.Afrin@mail.wvu.edu February 06, 2014
Objectives • Freeze rows and columns • Print large datasets • Understand table design • Create a table • Apply a table style • Sort data
Freezing rows and columns • Freezing keeps rows and columns visible during scrolling • View->Freeze Panes
Tables • A table is a structured range of related data formatted to enable data management and analysis • Excel tables offer many features not available to regular ranges
tables • Tables extend the capabilities of a range of data • Column headings stay onscreen without needing “Freeze Panes” • Sorting/Filtering of data • Table Styles • Automatic Autofill • Total Row • Structured References
Table Design • Record • A record is a collection of data about one entity. Each row in a table is one record. • Field • A field is an individual piece of data. Each column specifies a field.
Creating tables • Click a cell within the existing range of data, then Insert->Table • Verify the range, click Ok • Name Table • Choose Style
Working with Records and fields • Insert rows/columns • Delete rows/columns • Remove duplicate rows • Design -> Remove Duplicate Rows
Table Style Options • Design –> table style option group
Sorting Data • Sorting arranges records in a table • Sort on one column • Sort on multiple columns • Records can be sorted in ascending or descending order • The Sort Dialog Box can be used to sort by multiple fields • Data->Sort
Filtering Data • Filtering is the process of displaying only records that meet specific conditions. • Filtering can be turned on and off • Data->Filter
Structured references • Within a table, you may use the field names as references • Names go in brackets • @ indicates the current record • The table name is optional within the table, but required outside the table • TableName[@Field Name]
Total Row • Table Tools->Design->Total Row • The function used to calculate the total can be chosen via the dropdown • Additional totals can be added for other columns
Applying conditional formatting • Home->Conditional Formatting • Highlight Cells applies text and fill colors based on condition • Top/Bottom applies text and fill colors based on top/bottom percentage or top/bottom number of items • Data Bars, Color Scales, and Icon Sets • Helps visualize differences between data
Managing Conditional Formatting rules • Home->Conditional Formatting->Manage Rules • Can edit, delete, or create new rules
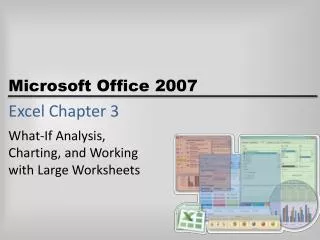
Day 9:Excel Chapter 6 Tazin AfrinTazin.Afrin@mail.wvu.edu February 06, 2014
Objectives • Group and ungroup data • Subtotal data • Create a PivotTable • Change the values field • Modify a PivotTable • Sort, filter, and slice a PivotTable • Create a calculated field • Format a PivotTable • Create a PivotChart
Outlines/GRoups • An outline is a hierarchical structure of data. • Excel will not create an outline or group data if the dataset does not contain a formula or an aggregate function such as SUM or SUBTOTAL.
Outlines/GRoups • Grouping is a process of joining related rows or columns of related data. • Groups allow you to hide raw data while you work with the calculations derived from that data • You can group rows or columns • Easily hide and unhide large chunks of data • Data->Group
Subtotal Data • Use Subtotal command to insert subtotal rows at each designated field change in a sorted range of data • Allows you to aggregate groups of data using one of several functions • Sum • Average • Variance • Standard Deviation • Min/Max • Count
Using group subtotals • Sort the data by the group identifier • Does not work on tables • Data->Subtotal • Select the sorted column for “At each change in:” • Select your aggregation function • Select which columns to subtotal
Pivot table • A PivotTable is an organized structure that summarizes large amounts of data. • Insert->PivotTable • Ensure the range is correct • Select target location (new worksheet or existing worksheet)
Adding rows • Drag field to Row Labels • Or, right click on field name -> Add to … • Check box to add to Values
Adding Columns • Drag field to Column Labels • Or, right click on field name -> Add to … • Automatically aggregates with SUM(), but you can choose a different function
Modify pivot table • Add and remove fields • Rearrange fields • Refresh
Updating Pivot Tables • PivotTables do not automatically update if you change the source data • You can force a refresh via PivotTable Tools->Options->Refresh
Pivot table options • Sorting • Filtering • Slicing
Pivot table options • Sorting • Click a cell in the column you would like to sort by, then PivotTable Tools->Options->Sort • Filters • Report Filters: drag the field to the “Report Filter” area, select desired values in B1 • Group Filters: Select dropdown arrow on row or column labels, select desired values
Pivot table options • Slicers • Slicers provide quick buttons to filter the PivotTable • PivotTable Tools->Options->Insert Slicer
Calculated field • A calculated field is a user-defined field that performs a calculation based on other fields in a PivotTable. • It is not found in the original data set • PivotTable Tools->Options->Fields, Items, & Sets->Calculated Field
Format a PivotTable • PivotTable Tools->Design • Layouts • Subtotals • Grand Totals • Compact/Outline/Tabular • Styles • Row header • Column header • Banded row/column • Table styles
Pivot charts • A PivotChart is a graphical representation of data in a PivotTable. • PivotTable Tools->Options->PivotChart • Chart adjusts to match the PivotTable • Edit from tools • Design , layout, format, analyze
Thank You Log Off