3D Sensor Studies at New Mexico
220 likes | 348 Views
3D Sensor Studies at New Mexico. Sally Seidel for Martin Hoeferkamp, Igor Gorelov, Elena Vataga, and Jessica Metcalfe University of New Mexico. Introduction. We have characterized 3D sensors of pitch 200 µm × 100 µm .

3D Sensor Studies at New Mexico
E N D
Presentation Transcript
3D Sensor Studies at New Mexico Sally Seidel for Martin Hoeferkamp, Igor Gorelov, Elena Vataga, and Jessica Metcalfe University of New Mexico
Introduction • We have characterized 3D sensors of pitch 200 µm × 100 µm. • We report probe station based studies of depletion voltage, leakage current, electrode capacitance, capture time, and signal rise time, supported by simulations • The devices: non-irradiated and irradiated (1014, 2×10¹⁴, 1015 cm-2 55-MeV-p), unannealed, from Sherwood Parker.
Picoprobe Model 35 (26 GHz bandwidth, 14 pS rise time, 0.05 pF capacitance) Picoprobe Model 12 (500 MHz bandwidth, 0.8 nS rise time, 0.1 pF capacitance) Kentech APG1 Pulser (300 pS pulse width) Tektronix 7254B Oscilloscope (2.5GHz bandwidth) 1064 nm, 960 nm, 820 nm IR lasers, 12GHz Photoreceiver Cascade REL-6100 semiautomatic probestation Micromanipulator HC-1000 Thermal Chuck (-60C) Peltier Thermal Chuck (-20C) Eichhorn+Hausmann MX203 wafer thickness and flatness gauge Equipment
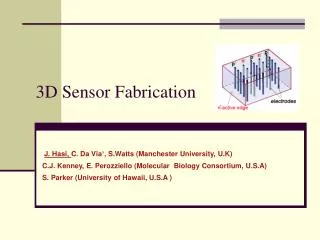
3D Sensor Configuration • Configuration of the devices: <100> p-type silicon. • Alternating columns of n- and p-electrodes • Most electrodes are connected together along each column • Some electrodes are left isolated, to be contacted and measured individually • Layout dimensions: 200 mm x 100 mm spacing, 17 mm electrode diameter, 121 mm electrode length. • Top view layout
Electrode Leakage Current • Measured leakage current versus fluence: • Prior to irradiation, the n-electrodes are shorted together by a surface electron layer.
Electrode Depletion Voltage • Pixel cell depletion voltage measured via LCR meter: • Pixel cell depletion voltage measured via pulse height:
Array Depletion Voltage • To test the entire device, we completely flood the 3D sensor with a uniform 1064 nm laser spot and scan the bias voltage above full depletion. • Photo with IR filter of laser illuminating the sensor:
Array Depletion Voltage • Array depletion measured from signal efficiency (pulse height relative to the maximum for the non-irradiated device) versus bias: • Result: very low values of depletion voltage for the entire sensor array, • Vdepletion ~ 15V for non-irradiated sensor • Vdepletion ~ 60V for sensor irradiated to 2x10¹⁴ • Vdepletion ~ 130V for sensor irradiated to 1x10¹⁵
Electrode Capacitance • Electrode capacitance usingstandard (HP4284A) LCR meter techniques • Electrode capacitance versus fluence, type, and frequency: Fluence (cm-2)ElectrodeFrequency(kHz) (55-MeV-p)type10 100 1000 0 p 71 58 46 0 n 59 38 32 2×10¹⁴ p 96 69 53 2×10¹⁴ n 72 72 62 1×10¹⁵ p 98 70 55 1×10¹⁵ n 91 80 60
Electrode Capacitance • Electrode capacitance versus temperature and frequency:
Pulsed1064 nm and 960 nm Laser +Vbias Gnd PICOPROBE 35 To Oscilloscope R= 1.25M C=.05pF Electrode Capacitance • Direct measurement is checked by indirect measurement through signal decay time : • Indirect measurement using decay time of IR pulse on an isolated electrode. • Electrode is grounded through input impedance of a Picoprobe 35. • The IR laser induced charge is collected. • When the laser is turned off the signal decay follows an exponential with a time constant = R*(C+C3D) , referred to here as RC time constant. • C3D is extracted from the decay time constant using values of probe resistance and capacitance.
Electrode Capacitance • Performed at different bias voltages, using the procedure of Parker et al., Proc. IEEE Trans. Nucl. Sci., Oct 2001, p. 1635: Isolated electrode grounded through the 1.25 MΩ input impedance of the picoprobe. T = 0 when the laser is turned off. After the light emission ends and the charge is collected, the pulse height follows an exponential of time constant 177 ns. Averaging the values for 50 V to 100 V gives a p-electrode capacitance of 91.6 fF. • Irradiated 2×1014 cm-2 55-MeV-p sensor p-electrode
Electrode Capacitance • A summary of the capacitance versus fluence for a p- and an n-electrode using the direct capacitance measurement technique and for the p-electrode using the indirect measurement technique. The indirect measurement gives about a 50fF higher result.
n n p p p n n Electrode CapacitanceCalculation • 3D electrostatic calculation (IES Coulomb): • p electrode length = 121 µm • p electrode diameter = 17 µm nominal • Center electrode to nearest neighbors Prediction for p electrode = 28 fF We are systematically varying the geometrical parameters to understand the impact of each one on capacitance. An example for electrode diameter: Capacitance at 17 mm is 28 fF
Position Scans • Scan the laser across one electrode cell to measure uniformity of signal collection Y X
Position Scans • Signal collection versus position: • Non-irradiated 3D sensor, p-electrode Y X
Pulsed1064 nm IR Laser +Vbias Gnd PICOPROBE 35 R= 1.25M C=.05pF Charge Collection • Pulse the IR Laser as fast as possible and observe the rise time of the signal • Measure the output rise time while reducing the laser pulse duration
Charge Collection • Input 0.3 nS laser duration: • Output non-irradiated p electrode, ~ 2.5 nS rise time • Output irradiated (1015) p electrode, ~1.5 nS rise time NOTE: The system isolation was improved, and a broken cable shield replaced, after this measurement was recorded. Revised graphs are in preparation.
Capture Time • For an irradiated 3D sensor, pulse the laser at a distance of 30 µm from the electrode and measure the output. Repeat with laser pulse at a distance of 90 µm.
Capture Time • The 60 µm difference in laser position results in a collection time difference of 50.6 nS – 47.4 nS = 3.2 nS NOTE: The system isolation was improved, and a broken cable shield replaced, after this measurement was recorded. Revised graphs are in preparation.
Plans Plans for 2007-2008: • Repeat charge collection and capture time measurement with new low-noise system. • Complete systematic simulation of full scope of geometrical options. • Implement TCAD device simulation for improved capacitance and charge collection prediction. • Systematics studies with 820 nm and 960 nm lasers. • Irradiate ATLAS geometry devices at LANL and Sandia. • Apply these measurement techniques to the ATLAS geometry devices. There is a larger range of measurements we would like to do additionally if a TurboDAQ system becomes available. We are 5 people available for testbeam staffing as well.
Budget for FY 2008 $110,000 for electrical engineer, travel, and materials and supplies.