Integrating Ecosystem Dynamics and Land Cover Change in Carbon Cycle Models
480 likes | 613 Views
This study investigates the interactions between ecosystem dynamics, land cover changes, and carbon cycling, focusing on cropland establishment and abandonment, atmospheric CO2 variations, and climatic factors. Using four process-based ecosystem models, the research analyzes the carbon storage from 1920 to 1992. It highlights how CO2 and land use significantly impact carbon dynamics compared to climate variability. The findings call for integrated modeling approaches to better understand these interactions and their implications for global change and terrestrial ecosystems.

Integrating Ecosystem Dynamics and Land Cover Change in Carbon Cycle Models
E N D
Presentation Transcript
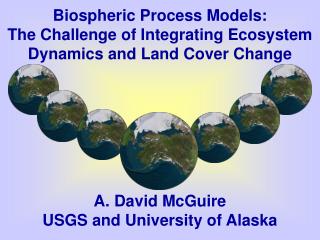
Biospheric Process Models: The Challenge of Integrating Ecosystem Dynamics and Land Cover ChangeA. David McGuireUSGS and University of Alaska
Landuse and Disturbance CO2 and Climate Process-Based Ecosystem Models Book-keeping Models Historically Two Approaches
CLIMATE Physical Properties Ecosystem Structure Ecosystem Function Human Dimensions DISTURBANCE Modeling Integration for Investigating Global Change in Terrestrial Ecosystems
Process Models and Atmospheric Constraints McGuire and CCMLP Participants. 2001. Carbon balance of the terrestrial biosphere in the twentieth century: Analyses of CO2, climate and land use effects with four process-based ecosystem models. 2001. Global Biogeochemical Cycles 15:183-206.Dargaville and CCMLP Participants 2002. Evaluation of terrestrial carbon cycle models with atmospheric CO2 measurements: Results from transient simulations considering increasing CO2, climate, and land-use effects. Global Biogeochemical Cycles 16, 1092, doi:10.1029/2001GB001426.Dargaville, R., A.D. McGuire, and P. Rayner. 2002. Estimates of large-scale fluxes in high latitudes from terrestrial biosphere models and an inversion of atmospheric CO2 measurements. Climatic Change 55:273-285.
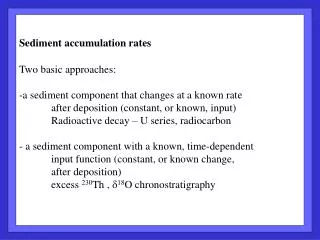
Goal of Study: … to simulate the concurrent effects of cropland establishment and abandonment, increases in atmospheric CO2, and interannual climate variability on terrestrial carbon storage between 1920 and 1992.
NPP RH Conversion Flux Product Decay Flux NET Fire Disturbance CO2 Concentration Climate (Temperature, Precipitation) TBM Carbon Pools 1 yr 10 yr Landuse Map 100 yr Product Pools Simulating the Effects of CO2, Climate, and Cropland Establishment and Abandonment by Terrestrial Biosphere Models (TBMs)
Driving Data Sets Historical CO2: based on Etheridge et al. (1996) and Keeling et al. (1995) Temperature: based on Cramer and Leemans climatology and Jones et al. (1994) temperature anomalies Precipitation: based on Cramer and Leemans climatology and Hulme et al. (1992, 1994, updated) precipitation anomalies Solar Radiation: based on Cramer and Leemans climatology Historical Landuse: based on Ramankutty and Foley (1998) Relative Agricultural Productivity: based on Esser (1990) Other Data Sets: vegetation and soils - model specific
Comparison between net fluxes simulated by terrestrial biosphere models with a long-term inversion analysis of terrestrial C exchange with the atmosphere Modeled terrestrial exchange is consistent (within the uncertainty) with the long-term inversion analysis.
Partitioning effects of CO2, climate, and cropland establishment and abandonment on global terrestrial carbon storage for HRBM,IBIS,LPJ and TEM The models indicate that the effects of CO2 and cropland establishment/abandonment play important roles in terrestrial carbon storage. The models agree that the effects of climate are small relative to the effects of CO2 and land use, but disagree about whether climate variability tends to cause net uptake or release of CO2.
HRBM IBIS LPJ TEM gC m2 yr-1 -1000 -10 -1 1 10 100 1000 Mean Annual Net Carbon Exchange for the 1980s (CO2, Climate, and Land Use)
HRBM IBIS LPJ TEM gC m2 yr-1 -1000 -10 -1 1 10 100 1000 Mean Annual Net Carbon Exchange for the 1980s (Land Use)
Regional Changes in Carbon Storage may be Caused by Responses that affect Ecosystem Physiology, Disturbance, and Land Cover Change McGuire et al. 2004. Canada and Alaska. Csiszar, I., et al. 2004. Land use and fires. Chapters 9 and 19 in Land Change Science: Observing, Monitoring, and Understanding Trajectories of Change on the Earth’s Surface. Dordrecht, Netherlands, Kluwer Academic Publishers.Zhuang et al. 2003. Carbon cycling in extratropical terrestrial ecosystems of the Northern Hemisphere during the 20th Century: A modeling analysis of the influences of soil thermal dynamics. Tellus 55B:751-776.McGuire et al. 2002. Environmental variation, vegetation distribution, carbon dynamics, and water/energy exchange in high latitudes. Journal of Vegetation Science 13:301-314.
Biomass of Boreal Forest Ecosystems has been Changing in Recent Decades From Myneni et al. (2001)
Growing seasons are occurring earlier Courtesy of K. McDonald
Duration of Snow Free Period 1972-2000 8.0 –18.0 Weeks–Region 1 18.0 – 28.0 Weeks – Region 2 28.0 –37.0 Weeks – Region 3 Snow Free Duration Anomaly (weeks) Based on TEM simulation for north of 30o N *D. Dye, Hydrol. Process., 2002
90° 60° 30° g C m-2 yr-1 -75 -60 -45 -30 -15 0 10 25 Sink Source Strategy to evaluate seasonal exchange of carbon dioxide simulated by terrestrial biosphere models Observed and simulated atmospheric CO2 concentrations at Mould Bay Station, Canada (-119.35oW, 76.25oN) during the 1980s Spatial patterns of change in vegetation carbon over the twenty year period spanning from 1980-2000 as simulated by the Terrestrial Ecosystem Model (TEM) Incorporation of freeze-thaw dynamics into the Terrestrial Ecosystem model improves the simulation of the seasonal and decadal exchange of carbon dioxide exchange with the atmosphere (Zhuang, Euskirchen, McGuire, Melillo, Romanovsky)
After crown fires, boreal conifer forests are often replaced by less flammable deciduous broad-leaved vegetation
NCE [CO2] and [O3] and N Deposition NPP RH Fire Emissions Climate (Temperature, Precipitation) TEM Carbon Pools Fire regime (Severity, History) Simulation of the effects of changes in [CO2], [O3], N deposition, Climate, and Disturbance by the Terrestrial Ecosystem Model (TEM)
Uptake * Pre-historical Fire Return Interval (before 1950) ** Fire Return Interval (1950-1995) Release JSC 7/23/02
The high latitude transects span significant variation in several environmental variables and provide a network for improving our understanding of controls over vegetation dynamics, carbon dynamics and water/energy exchange in high latitudes
Ground fires are typical in fire regime of Scots Pine Forests in Central Siberia Courtesy of Doug McRae
Crown fires are typical in fire regime of Boreal Forests in Far East Siberia and North America Courtesy of Doug McRae
Comparison of the average change in Seasonal Severity Rating (SSR) for Canada and Russia using the Canadian General Circulation Model (GCM) under left) a 1 x CO2, and right) a 2 x CO2 climate (from Stocks et al. 1998). Severity rating ranges from extreme (red), high (orange), moderate (yellow) to low (green).
Regional Processes: The Challenge of Multiple Disturbances Joyce et al. Harvesting disturbances on U.S. forestland from 1600 to present. In preparation.McGuire et al. Historical changes in carbon storage of the eastern United States: Uncertainties associated with forest harvest and agricultural activities. In preparation.
Overall Goals • Develop land use model that allows native ecosystems • to convert to agriculture, harvest occurrence in • forests, and the creation the age cohorts following • harvest and cropland abandonment. • Compare modeled age class distribution with • independent inventory data on stand age • distributions • Use data sets on forest disturbance to drive the • Terrestrial Ecosystem Model (TEM) and evaluate how • assumptions about CO2 fertilization and depletion • of soil N by agricultural activities influence estimates • of changes in carbon storage of the eastern US
Methods to Estimate Harvest Area • Anecdotal information prior to 1952 • Used inventory data summarized by state/region from 1952, 1962, 1977, 1987, 1992, 1997, and 2002 • 1600 to 1952 • Trend extrapolation based on state population • Assume no harvest disturbance prior to European settlement • 1952 to 2002 • Model harvested area using inventory data (volume, removals, timberland and forest area) and the limited data available on actual harvested area • Linear interpolation between inventory years
Development of the Land Use Model • Agricultural Land Use • If cropland increases, conversion draws from oldest native vegetation, with a preference for secondary growth. • If cropland decreases, the oldest cropland is converted back to native vegetation • Forest Harvest • Harvest oldest native vegetation first, with a preference for primary forest
Modeled estimates of total forestland area follow the temporal dynamics of inventory forestland estimates and are within 6 to 10%.
Forest Harvest Area by Region and US1980-90 FIA Data and Modeled Estimates
Summary: Estimating Harvested Area • Development of a method to obtain nationally consistent estimates of harvested area from 1600 to 2002 • Linked forest land use change with agricultural land use; resulting projections of forest land are within 6 to 10 percent of recent inventory • Comparison with independent data on stand age is good where harvest is the major disturbance • Where other disturbances such as fire, comparison of stand-age distributions are weak
NPP RH Conversion Flux Product Decay Flux NET Fire Disturbance CO2 Concentration Climate (Temperature, Precipitation) TEM Carbon Pools 1 yr 10 yr Landuse Map 100 yr Product Pools Simulating the Effects of CO2, Climate, Forest Harvest, and Cropland Establishment and Abandonment by TEM
Comparison of forest growth curves between TEM and Birdsey (1995)
Effects of Cropland Establishment and Abandonment on Soil Carbon and Nitrogen Storage
Northeast Region Forest growth as a function of stand age in the TEM simulations is sensitive to assumptions about the effects of agriculture on the depletion of ecosystem nitrogen stocks through time. When nitrogen lost in agricultural production is not replaced (maximum N loss), forest regrowth after agricultural abandonment is not able to achieve the biomass of forests that were never harvested. When the lost nitrogen is replaced immediately after lost (minimum N loss), forest regrowth after agricultural abandonment is able to achieve the biomass of forests that were never harvested. Forest growth as a function of stand age in the TEM simulations is sensitive to assumptions about the effects of agriculture on the depletion of ecosystem nitrogen stocks through time. When nitrogen lost in agricultural production is not replaced (maximum N loss), forest regrowth after agricultural abandonment is not able to achieve the biomass of forests that were never harvested. When the lost nitrogen is replaced immediately after lost (minimum N loss), forest regrowth after agricultural abandonment is able to achieve the biomass of forests that were never harvested.
Average annual vegetation C flux 1988-1992 (Tg C) $ TEM simulations (forest cells only) * Birdsey and Heath posted on the web the carbon estimates in forest land for 1987, 1992, and 1997 by state at http://www.fs.fed.us/ne/global/pubs/books/epa/index.html
Conclusions • Biospheric process models provide a mechanistic means of • evaluating the relative role of different drivers of changes in • regional carbon storage, but are poorly constrained by extant atmospheric data. • At the regional scale, changes in carbon storage may be affected by responses to drivers that affect ecosystem physiology (e.g., CO2, climate, O3, N deposition) as well as changes that affect ecosystem structure (e.g., disturbance and land use). • It is important to account for historical legacies associated with • disturbance regimes like fire. • Age class distributions are generally the outcome of multiple disturbances, and it is a challenge to identify all of the disturbances that need to be considered. • Comparison with inventory analyses is useful, but may not resolve controversies about the relative role of different drivers of changes in regional carbon storage.