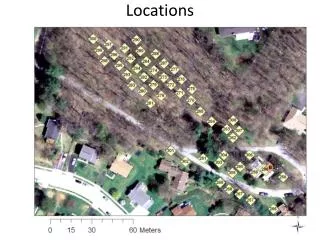
Locations
Locations. Soil Temperature Dataset. Observations. Data is Correlated in time and space Evolving over time (seasons) Gappy (Due to failures) Faulty (Noise, Jumps in values). Temporal Gap Filling. Data is correlated in the temporal domain Data shows Diurnal patterns Trends

Locations
E N D
Presentation Transcript
Observations • Data is • Correlated in time and space • Evolving over time (seasons) • Gappy (Due to failures) • Faulty (Noise, Jumps in values)
Temporal Gap Filling • Data is correlated in the temporal domain • Data shows • Diurnal patterns • Trends • Trends are modeled using slope and intercept • Correlations captured using functional PCA
Gap Filling (Connolly & Szalay)+ Original signal representation as a linear combination of orthogonal vectors • Optimization function • - Wλ= 0 if data is absent • Find coefficients, ai’s, that minimize function. + Connolly et al., A Robust Classification of Galaxy Spectra: Dealing with Noisy and Incomplete Data, http://arxiv.org/PS_cache/astro-ph/pdf/9901/9901300v1.pdf
Gap-filling using Daily Basis Good Period Only 2% of the data could be filled using daily model
Observations • Hardware failures causes entire “days” of data to be missing • Temporal method (only using temporal correlation) is less effective • If we look in the spatial domain, • For a given time, at least > 50% of the sensors are active • Use the spatial basis instead. • Initialize spatial basis using the period marked “good period” in previous slide
Gap-filling using sensor correlations Faulty data Too many missing readings for this period (Snow storm!)
Accuracy of gap-filling High Errors for some locations are actually due to faults Not necessarily due to the gap-filling method
Observations & Incremental Robust PCA * • Data are faulty • Pollutes the basis • Impacts the quality of gap-filling • Basis is time-dependent • Correlations are changing over time • Simultaneous fault-detection & gap-filling • Initialize basis using reliable data • Using basis at time t, • Detect and remove faulty readings • Weight new vectors depending on residuals • Update thresholds for declaring faults • Iterate over data to improve estimates + Budavári, T., Wild, V., Szalay, A. S., Dobos, L., Yip, C.-W. 2009 Monthly Notices of the Royal Astronomical Society, 394, 1496, http://adsabs.harvard.edu/abs/2009MNRAS.394.1496B
Iterative and Robust gap-filling • Fault removal leads to more gaps and less data to work with • However, data looks much cleaner.
Impact of number of missing values Even when > 50% of the values are missing Reconstruction is fairly good