Download
1 / 18
190 likes | 234 Views
Understand the principles of Lean Manufacturing and apply them to transactional processes. Learn how to identify measurable indicators of quality, eliminate waste, and drive improvement. Discover how to use tools like VSM and control charts for process optimization.

E N D
TPS (Lean Mfg) and Transactional processes John Finley
Objectives • Understand how Lean applies to all processes • Understand how to find measurables in any process
“For any student of History - Change is the Law of life. Any attempt to contain it guarantees an explosion down the road. The more rigid the adherence to the status quo, the more violent the ultimate outcome will be.” Lean Quality Management Is About Change Henry Kissinger
What is Lean Mfg (Toyota Production System)? • Lean Manufacturing is a way of looking at the production of goods and services where: • Define value in the eyes of the customer • Map the Value Stream through the process • Create flow in the value stream by eliminating waste • Pull the value from the customer through the value stream • Keep striving for perfection in the above statements.
What is a transactional process • Simply, this is a process where no tangible product is made • Examples: • Purchase order generation • Customer order generation • Customer Service • Design processes • Engineering changes
Don’t these have products? • Yes, we have PO’s, Customer concern resolutions, Shop orders,New and Changed drawings • BUT, • How often do we apply the very first Lean principle, “Define Value in the Eyes of the Customer” • Who is the customer? • What is the measurable indicator of quality? • Do we monitor that KPI (Key Process Indicator)?
Remember the 8 wastes How do these apply to transactional processes? Let’s look at some examples
Defects • Errors on the purchase order • Design without regard to manufacturability • Errors in shop orders • Anything that leads to reprocessing the same work
Overproduction • Excess paper work not necessary to the production of customer value • Build up of stock orders
Waiting • Built-in delays in the system • Multiple approvals needed
Inventory • Backlog of purchase requisitions waiting to be processed • Backlog of purchase orders waiting for approval • Backlog of design changes waiting for approval
Where do we start? • As in most lean applications, the starting point is a value stream analysis • VSM takes each step in the process and details the total cycle time, the value added time and the inventory (in this case time) between each step • The following slide has a VSM for the process of shipping product from a Mexican plant to a Canadian distribution center • The customer value being tracked here is order lead time
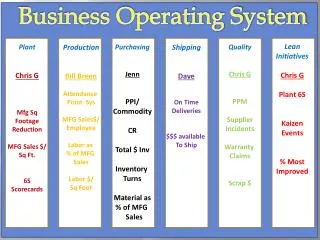
How do we improve • We select a measurable from one process • Chart the measurable to make sure it is stable • Do a short, controlled event to try to make an improvement (Kaizen event) • Continue measuring to see if we have made an improvement • Calculate the effect of the one process on the overall deliverable • The next slide suggests some measurables for a customer order process
Customer Driven Supply Chain – Proposed Metrics On-going Metrics: The Perfect Order – Complete,Accurate,On-Time, Perfect Condition • Order Accuracy • % of orders entered correctly the first time • % correct acknowledgements • # of order cancellations • % invoiced correctly • On Time Performance • To Customer Requested Delivery Date • To Customer Promise Ship Date • Span (+/- days to CRDD) / Variance • Improvement to Span metric over time • # of past due orders • Recommit promise date accuracy / timeliness • Received Complete • % shipped complete (fill rates) • % received complete (fill rates) • Issue Resolution • # of interactions due to issues • Phone Calls per Order • 1st Contact Resolution • Resolution Time • Issued Credits • RMA performance (product replacement / # / $ / Time / long term resolution to issues) • RES - $ fines for missed shipments • Cost of Poor Quality / Warranty Claim $’s Periodic Tracking Metrics • Customer Satisfaction Index (CSI) • Net Promoter Score (NPS) • Net Delighted Score (NDS) Metrics support and drive strategy, initiatives and decision making
What tools can we use to measure • P and NP charts • Based on the binomial distribution • The chart that Deming used the most • Uses the proportion defective (or non-defective) as the measurable • C and U charts • Based on the Poisson distribution • Used for count data like number of errors (C chart) or errors per unit (U chart)
Dirty little secret • P charts are hard for the layman to understand because the limits change with the sample size • A p chart that is in or out of control with more than 20 points will show exactly the same variation and in or out of control status if plotted as an individuals chart (minus the moving range chart) • Now we have one Upper and one Lower limit that are much easier to understand
Summation • Non manufacturing processes can be improved using Lean and statistical methods • As with any improvement it all starts with a measurable and ALL processes have measurables • Statistical techniques can still be used including: • Control charts • Regression analysis (may have to use Binary Logistic Regression) • Even Design of Experiments can apply in certain circumstances • Bottom Line: Lean applies to ALL portions of a business