Download
1 / 33
330 likes | 533 Views
Determination of Precipitation Contamination. Derek Anderson Teri Wilson. Hypothesis. We believe that snow is purer than rain. The Six Common Air Pollutants. Ozone Particulate Matter Carbon Monoxide Nitrogen Oxides Sulfur Dioxide Lead. Nitrogen Oxides (NOx).

E N D
Determination of Precipitation Contamination Derek Anderson Teri Wilson
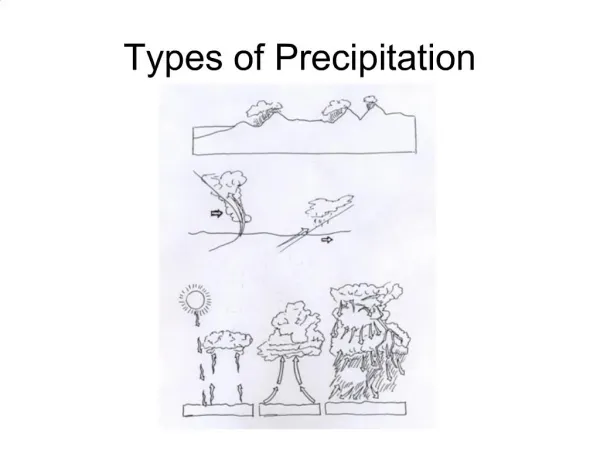
Hypothesis We believe that snow is purer than rain.
The Six Common Air Pollutants • Ozone • Particulate Matter • Carbon Monoxide • Nitrogen Oxides • Sulfur Dioxide • Lead
Nitrogen Oxides (NOx) • Most common are: nitrogen dioxide (NO2) and nitric oxide (NO) • Primary sources are: kerosene heaters, un-vented gas stoves/heaters, and environmental tobacco smoke • Causes eye, nose, and throat irritation • National Ambient Air Quality Standard for Nitrogen Dioxide: <0.053ppm
Lead (Pb) • A metal found naturally in the environment as well as in manufactured products • Once taken into the body, lead distributes throughout the body in the blood and accumulates in the bones • Lead exposure affects the oxygen carrying capacity of the blood • National Ambient Air Quality Standard for Lead: <0.15μg/m3
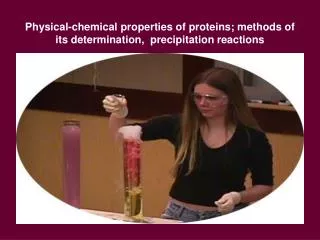
Collection Method • Samples were collected outside of Teri’s garage • Collected in clean, dry plastic containers • Poured into sterile glass jars and covered securely • Stored in the refrigerator until testing
Testing • Dionex ICS-90 Ion Chromatography (IC) • HP 8453 Diode Array UV/Vis Spectrophotometer • Varian Inductively Coupled Plasma (ICP-OES)
IC Experiment • Analyte of Interest • Nitrate and Nitrite • Standards Used • 7 Anion Standard • Standard 1 – 10 ppm • Standard 2 – 15 ppm • Standard 3 – 20 ppm • Standard 4 – 25 ppm • Standard 5 – 100 ppm
IC Parameters • Pressure: 890 psi • Flow rate: 1 mL/min • Pressure Gauge: Slightly above 9
Calculated Nitrite Concentrations * Negative numbers denote negligible values
UV/Vis Experiment • Analyte of Interest • Nitrate • Standards Used • Standard 1 – 5 ppm • Standard 2 – 10 ppm • Standard 3 – 15 ppm • Standard 4 – 20 ppm • Standard 5 – 25 ppm
UV/Vis Parameters • Mode: Standard • Task: Fixed Wavelength • 224 nm • Data Type: Absorbance & Second Derivative • Path Length: 1 cm
Calculated Nitrate Concentrations * Negative numbers denote negligible values Results produced indicate method is not compatible and did not work for our purposes.
Calculated Nitrate Concentrations Even using the Second Derivative Mode, results indicated the method did not work and was not compatible for our purposes.
ICP Experiment • Analyte of Interest • Lead (II) • Standards Used • Blank – 0 ppm • Standard 2 – 40 ppm • Standard 3 – 60 ppm • Standard 4 – 80 ppm • Standard 5 – 100 ppm
ICP Parameters • Search for Pb(II) at: • 179.605 • 182.143 • 220.353 • Used Pb(II) at 220 based upon UV/Vis wavelength obtained
Discussion • UV/Vis data did not provide results of significance • ICP yielded negligible concentrations of lead in samples • Overall results support Freezing Rain to contain higher levels of Nitrogen Oxides (NOx)
Troubleshooting • Sample Nitrite values are below IC sensitivities • IC baseline is below 0.00 • UV/Vis protocol not understood
Summary • The original hypothesis that snow is purer than rain was rejected based on our findings • No specific precipitation type yielded more pure results than another • Only that Freezing Rain contained significantly higher concentrations of Nitrogen Oxides
References Evaluation of a second derivative UV/visible spectroscopy technique for nitrate and total nitrogen analysis of wastewater samples Michelle A. Ferree and Robert D. Shannon Water Research 200135 (1), p. 327-332. What Are the Six Common Air Pollutants. http://www.epa.gov/ebtpages/airairpollutants.html. 2 April 2011.