Download
1 / 6
60 likes | 171 Views
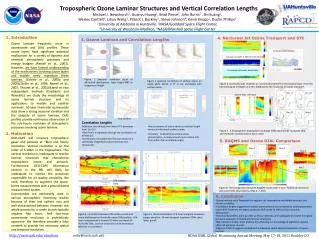
Comparing Tropospheric Ozone in 2000 and 2011. By: Aaron Jennison. Data. The data was taken from: www.georgiaair.org/amp/amp_query.html Data collected by ultraviolet photometry. Collected between March 1 to October 31. The measurements were taken in Gwinnett. Data. Data.

E N D
Comparing Tropospheric Ozone in 2000 and 2011. By: Aaron Jennison
Data • The data was taken from: www.georgiaair.org/amp/amp_query.html • Data collected by ultraviolet photometry. • Collected between March 1 to October 31. • The measurements were taken in Gwinnett.
Reason for Difference • The collected data for 2011 had many hours where there wasn’t a measurement. • Clouds and rain affected collection of data. • It rained much less in 2000 than in 2011. • In 2000 it rained 21.77 inches and in 2011 it rained 25.43 inches in between March and October.
Sources of Ozone • Industrial activity and burning of fossil fuels. • Trees, which produce isoprene. • Population growth in Gwinnett has risen from 588,448 in 2000 to 805,321 in 2010. • Yet 2011 had less hazardous days. • So trees may be contributing more to tropospheric ozone than (assumed) more pollution.