Download

1 / 13
130 likes | 346 Views
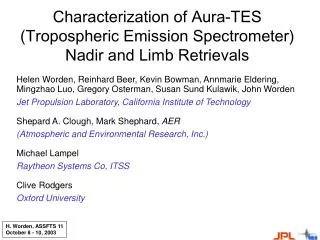
Dylan Jones University of Toronto. Constraints on Free Tropospheric Ozone from the Tropospheric Emission Spectrometer (TES). Thomas Walker ( University of Toronto) Mark Parrington (University of Edinburgh) Kevin Bowman, John Worden (JPL) Anne Thompson (Penn State)

E N D
Dylan JonesUniversity of Toronto Constraints on Free Tropospheric Ozone from the Tropospheric Emission Spectrometer (TES) Thomas Walker (University of Toronto) Mark Parrington (University of Edinburgh) Kevin Bowman, John Worden (JPL)Anne Thompson (Penn State) David Tarasick(Environment Canada)IvankaStajner (Noblis) Lee Murray (Harvard U.)
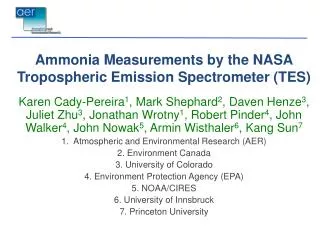
Tropospheric Emission Spectrometer (TES) Averaging kernels for retrieval at 30°N, 87°W 150 - 50 hPa 500 - 150 hPa 1000 - 500 hPa 70-90 hPa • One of four instruments on the NASA Aura spacecraft (launched July 2004) • Infrared Fourier transform spectrometer (3.3 - 15.4 m) • Nadir footprint = 8 km x 5 km • Orbit repeats every 16 days 400 hPa 700 hPa Objective: Assess the impact of assimilating TES data on surface ozone in GEM-MACH
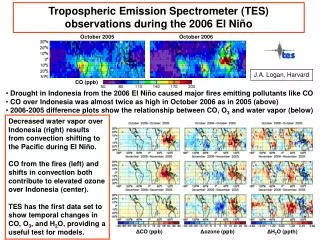
With TES assimilation (7 km) Without assimilation (7 km) Ozone Analysis for Aug 1-15th, 2006 • TES data were assimilated from 1 Jul. to 31 Aug. 2006 into GEOS-Chem using a sequential Kalman filter • Assimilation of TES data significantly increased ozone abundances across the extratropics
Ozone Analysis Over North America (at 5 km on 15 August 2006) After assimilation Before assimilation ppb [Parrington et al., JGR, 2008] • Assimilation of TES data increased O3 across North America by up to 40% • Large increases in O3 in the eastern Pacific, in the vicinity of a stratospheric intrusion, and across Canada, linked to stratosphere-troposphere exchange • The summertime O3 maximum over the southeast is more pronounced after assimilation
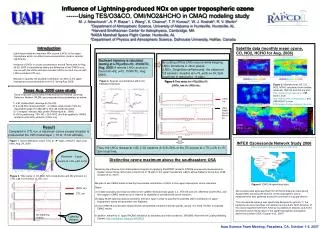
NOx O3 without TES assim O3 with TES assim Modelled O3 Over North America along 40°N [Parrington et al., JGR, 2008] The upper tropospheric ozone maximum is linked to NOx emissions from lightning, which were 0.068 Tg N for North America (in August), a factor of 4 lower than recommended by Hudman et al. [JGR, 2007] based on comparisons of the model with aircraft data.
Sonde profile Before assim After assim Comparison with IONS-06 Ozonesondes Over North America Mean (August 2006) O3 profile over North America (model sampled at the ozonesonde observation time and location) Mean Profiles Difference relative to sondes [Parrington et al., JGR, 2008] Significant improvement in fee tropospheric O3 (300 - 800 hPa) after assimilation. The bias was reduced from a maximum of -35% to less than 5% (between 300-800 hPa).
Comparison of TES analysis with assimilation of OMIand MLS GMAO OMI+MLS ozone assimilation GEOS-Chem ozone (7-8 km) for Aug. 2006 Northern midlatitude in better agreement after assimilation of TES data GEOS-Chem with TES assimilation GMAO – GEOS-Chemdifferences GMAO – G-C with TES GMAO – G-C without TES Over Asia, the biased between GMAO ozone and GEOS-Chem decreased from 6.8 ppb to 1.4 ppb after TES assimilation [Worden et al., JGR, 2009]
GMAO OMI+MLS analysis TES assimilation Without TES assimilation Mean Ozone (Aug. 2006) Along 45°E Comparison of TES ozone analysis with assimilation of OMI and MLS • The O3 distribution in the TES analysis is more consistent with OMI+MLS • The Middle East ozone maximum is reduced in the TES assimilation, relative to the free running simulation [Worden et al., JGR, 2009]
Before assimilation After assimilation • The model overestimates surface ozone in the east and underestimates it in the west • Assimilation increases surface O3 by as much as 9 ppb, with the largest increase in western North America Impact of TES Assimilation on Surface Ozone (Aug. 2006) Surface O3 difference (assim - no assim) AQS and NAPS surface O3 data • TES-based estimates of background O3 are 20-40 ppb Background O3 at the surface after assim Background O3 at the surface before assim [Parrington et al., GRL, 2009]
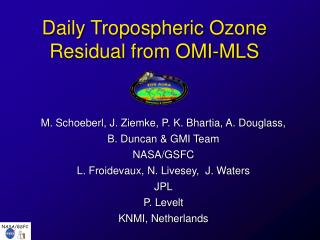
Evaluation with surface ozone measurements Sites sensitive to background O3: TES assimilation reduced the bias Sites sensitive to local O3 production: bias enhanced • Assimilating TES data reduces the model bias in western North America at the sites most sensitive to background ozone • Large residual bias at sites such as Egbert, Sumatra, and Table Mt. due to the coarse model resolution
Assimilation of TES data provides sufficient information to constrain the vertical structure of ozone in the free troposphere We are interested in assimilating the TES data to assess their impact on the ozone simulation in GEM-MACH, with a focus on surface ozone forecasts in North America. (We will use MLS data to constrain stratospheric ozone.) Since the TES observational coverage is poor, an important issue to examine is the trade-off between vertical resolution and spatio-temporal coverage of free tropospheric ozone observations We are interested in comparing the impact of TES and OMI data on the surface ozone fields Summary and Future Work
Comparison of the new model with assimilated ozone v8 GEOS-Chem O3 Aug 2006, 5 km O3 in v8 of GEOS-Chem with new lightning NOx source(and with biomass burning emissions based on GFED3) TES Assimilation Aug 2006, 5 km In the middle troposphere, relative to the TES assimilation, the mean bias between 20º-50ºN in the model decreased from about -7 ppb to 2 ppb with the new lightning NOx source
Chemical Data Assimilation Methodology Sequential sub-optimal Kalman filter: Observation Operator: Kalman Gain Matrix: Analysis Error Cov. Matrix: Model • GEOS-Chem model with detailed nonlinear tropospheric chemistry • Linearized (LINOZ) O3 chemistry in the stratosphere • Model transport driven by assimilated meteorological fields (GEOS-4) from the NASA GMAO (at a resolution of 2° x 2.5° or 4° x 5° ) • O3 and CO profile retrievals from TES are assimilated from 1 Jul. - 31 Aug. 2006 • 6-hour analysis cycle • Assumed initial forecast error of 50% for CO and O3 • Neglected horizontal correlations in forecast and observation error covariance matrices