Runoff Processes
Runoff Processes. Reading: Applied Hydrology Sections 5.6 to 5.8 and Chapter 6 for Thursday. Surface water. Watershed – area of land draining into a stream at a given location Streamflow – gravity movement of water in channels Surface and subsurface flow


Runoff Processes
E N D
Presentation Transcript
Runoff Processes Reading: Applied Hydrology Sections 5.6 to 5.8 and Chapter 6 for Thursday
Surface water • Watershed – area of land draining into a stream at a given location • Streamflow – gravity movement of water in channels • Surface and subsurface flow • Affected by climate, land cover, soil type, etc.
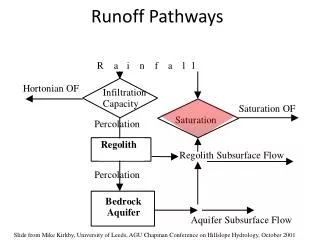
Streamflow generation • Streamflow is generated by three mechanisms • Hortonian overland flow • Subsurface flow • Saturation overland flow
Denudation Erosion and weathering control the extent of critical zone development Weathering front advance
Sediment Water, solutes and nutrients Critical zone architecture influences sediment sources, hydrology, water chemistry and ecology
Oregon Coast Range- Coos Bay Channel head Anderson et al., 1997, WRR. Montgomery et al., 1997, WRR Torres et al., 1998, WRR
Hortonian Flow • Sheet flow described by Horton in 1930s • When i<f, all i is absorbed • When i > f, (i-f) results in rainfall excess • Applicable in • impervious surfaces (urban areas) • Steep slopes with thin soil • hydrophobic or compacted soil with low infiltration Rainfall, i i > q Infiltration, f Later studies showed that Hortonian flow rarely occurs on vegetated surfaces in humid regions.
Subsurface flow • Lateral movement of water occurring through the soil above the water table • primary mechanism for stream flow generation when f>i • Matrix/translatory flow • Lateral flow of old water displaced by precipitation inputs • Near surface lateral conductivity is greater than overall vertical conductivity • Porosity and permeability higher near the ground • Macropore flow • Movement of water through large conduits in the soil
Saturation overland flow • Soil is saturated from below by subsurface flow • Any precipitation occurring over a saturated surface becomes overland flow • Occurs mainly at the bottom of hill slopes and near stream banks
Streamflow hydrograph Direct runoff • Graph of stream discharge as a function of time at a given location on the stream Baseflow Perennial river Snow-fed River Ephemeral river
Excess rainfall • Rainfall that is neither retained on the land surface nor infiltrated into the soil • Graph of excess rainfall versus time is called excess rainfall hyetograph • Direct runoff = observed streamflow - baseflow • Excess rainfall = observed rainfall - abstractions • Abstractions/losses – difference between total rainfall hyetograph and excess rainfall hyetograph
Green-Ampt Method • Apply the Green-Ampt method to rainfall in intervals of time: t, t + Δt, t + 2Δt, …
Soil Map Unit Soil Class Hydrologic Soil Group
Green-Ampt Parameters for Soil Map Units Lookup Table mm/hr mm
Green-Ampt in HEC-HMS • initial saturation as a volume ratio – θi • total porosity as a volume ratio – n • wetting front soil suction head – ψ • hydraulic conductivity – K • percent of basin with impervious cover
Impervious Cover 1104 Brushy Bend Dr Walsh Dr Interpreted from remote sensing
Precipitation Time SCS method • Soil conservation service (SCS) method is an experimentally derived method to determine rainfall excess using information about soils, vegetative cover, hydrologic condition and antecedent moisture conditions • The method is based on the simple relationship that Pe = P - Fa – Ia Pe is runoff depth, P is precipitation depth, Fa is continuing abstraction, and Ia is the sum of initial losses (depression storage, interception, ET)
Precipitation Time Abstractions – SCS Method • In general • After runoff begins • Potential runoff • SCS Assumption • Combining SCS assumption with P=Pe+Ia+Fa
SCS Method (Cont.) • Surface • Impervious: CN = 100 • Natural: CN < 100 • Experiments showed • So
SCS Method (Cont.) • S and CN depend on antecedent rainfall conditions • Normal conditions, AMC(II) • Dry conditions, AMC(I) • Wet conditions, AMC(III)
SCS Method (Cont.) • SCS Curve Numbers depend on soil conditions
Land Cover Interpreted from remote sensing
Example - SCS Method • Rainfall: 5 in. • Area: 1000-ac • Soils: • Class B: 50% • Class C: 50% • Antecedent moisture: AMC(II) • Land use • Residential • 40% with 30% impervious cover • 12% with 65% impervious cover • Paved roads: 18% with curbs and storm sewers • Open land: 16% • 50% fair grass cover • 50% good grass cover • Parking lots, etc.: 14%
Example (SCS Method – 1, Cont.) CN values come from Table 5.5.2
Example (SCS Method – 1 Cont.) • Average AMC • Wet AMC