Download
1 / 5
50 likes | 249 Views
SSIP Process A S uggested Pathway, Timeline and Gantt Chart. WRRC Regional Forum Eugene October 31 and November 1, 2013. A Suggested Pathway. Data analysis across several indicators of performance (results) for children with disabilities (SPP/APR and other indicators).

E N D
SSIP ProcessA Suggested Pathway, Timeline and Gantt Chart WRRC Regional Forum Eugene October 31 and November 1, 2013
A Suggested Pathway Data analysis across several indicators of performance (results) for children with disabilities (SPP/APR and other indicators) Annual Evaluation of Progress, Adjustments Local Implementation Infrastructure Analysis Evaluation Plan Prioritization Process Infrastructure Development to Support Improvement (Capacity Building) Identify Area that Needs Improvement (e.g. reading proficiency) Supports for Implementing Best Practices Root Cause, Drill Down Analysis Theory of Action Contributing Factor(s) for which state will focus improvement strategies Evidence-based solutions and Possible Strategies (Best Practices) that fit the focus for improvement Systemic barriers and leverage points
Determine contributing factors of problems in areas for improvement Identify and analyze key data, from APR and other sources, disaggregate data Establish baselines and targets for all indicators Refine data analysis – addressing issues of data quality Root Cause Analysis Start SPP/APR and Phase I of SSIP Activities Draft SSIP Identify focus for improvement Identify areas for improvement Draft Theory of Action Conduct infrastructure analysis February 2015 Submit APR FALL 2013 SPRING 2014 SUMMER 2014 FALL 2014 Engage stakeholders in determining areas for improvement and focus for improvement Inform stakeholders re. changes to SPP/APR & SSIP* Work with LEAs/LAs and other stakeholders to identify and select evidenced based practices Review Theory of Action with stakeholders Plan: consider the management of the SSIP process including the activities related to the design and implementation of the SSIP Data Related Activities * Please refer to OSEP Memorandum 05-12 regarding requirements for stakeholder input. SSIP Specific Activities State Processes
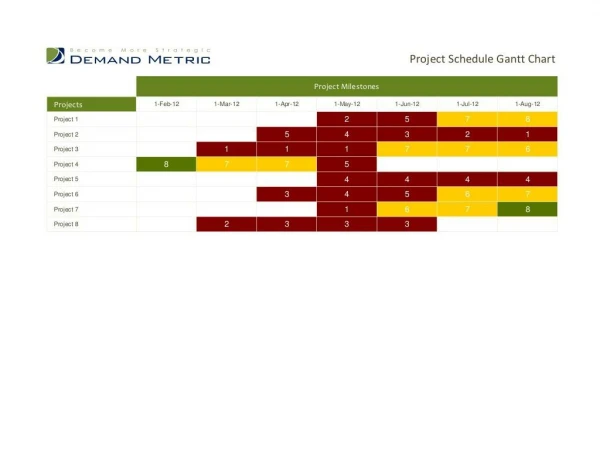
Phase I ● at-a-glance February 2015 Submit APR Data Analysis • Focus for Improvement • Infrastructure Analysis • Theory of Action FALL 2013 SPRING 2014 SUMMER 2014 FALL 2014 Phase II ● at-a-glance February 2016 Submit APR Evaluation Plan • Infrastructure Development • Support LEA/LA Implementation FALL 2014 SPRING 2015 SUMMER 2015 FALL 2015 Phase III ● at-a-glance Support LEA/LA Implementation • Results of Ongoing Evaluation • Revise SPP February 2017 Submit APR FALL 2015 SPRING 2016 SUMMER 2016 FALL 2016