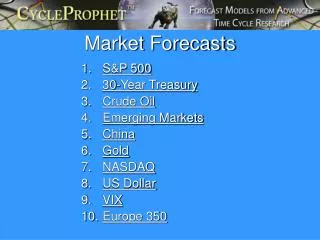

Noneconometric Forecasts
E N D
Presentation Transcript
Noneconometric Forecasts Su, Chapter 11
Judgmental Forecasts • Based on subjective opinions • Quick and Painless • Most popular forecast used by business • Often used when many factors affect the variable being forecast and little or no data are available
Economic Indicators • Much like naïve forecasts • Examine many economic series over a long period of time • Determine which ones have turned down (up) before the “total business climate” turns down (up): Leading • Turn down (up)at the same time: Coincident • Turn down (up) after: Lagging
Harvard ABC Curves • Early Example of economic indicators • A: Index representing speculation [stock prices] • B: Index representing business activity [dollar volume of checks drawn on bank deposits] • C: Index representing the money market [interest rate on short term commercial loans] • Collapsed during great depression
Constructing Indicators: Determine Reference Cycles • Reference Cycles: Reflect general business cycle movements in the economy • Indicators are all about timing - first question is timing relative to what? • “Total Business Climate” as reflected by reference cycles • Reference Cycles consist only of timing of turning points
Reference Cycle Determination: Recessions • The NBER does not define a recession in terms of two consecutive quarters of decline in real GNP. Rather, a recession is a recurring period of decline in total output, income, employment, and trade, usually lasting from six months to a year, and marked by widespread contractions in many sectors of the economy.
Reference Cycle Determination: Growth Recessions • A growth recession is a recurring period of slow growth in total output, income, employment, and trade, usually lasting a year or more. A growth recession may encompass a recession, in which case the slowdown usually begins before the recession starts, but ends at about the same time. Slowdowns also may occur without recession, in which case the economy continues to grow, but at a pace significantly below its long-run growth
Reference Cycle Determination: Depressions • A depression is a recession that is major in both scale and duration.
Reference Cycles and the NBER • The determination that the last recession ended in March 1991 is the most recent decision of the Business Cycle Dating Committee of the National Bureau of Economic Research. • Announcement dates: • The March 1991 trough was announced December 22, 1992. • The July 1990 peak was announced April 25, 1991. • The November 1982 trough was announced July 8, 1983. • The July 1981 peak was announced January 6, 1982. • The July 1980 trough was announced July 8, 1981. • The January 1980 peak was announced June 3, 1980.
Reference Cycle Data • Available from 1854 - present at the NBER web site, along with other information
Constructing Indicators: Study Cyclical Movements • After determining the reference cycles, NBER looked at many monthly, quarterly, and annual time-series, removed trends, cyclical factors and seasonal variation • Cyclical movements were compared to the Reference Cycle, series were separated into four groups, based on movements • In 1950: 80 Cyclical series, 30 Leading, 15 Coincident, 7 Lagging, 28 others
Current Cyclical Indicators • List is often revised • Currently consists of 250 series • Now maintained by The Conference Board • Web site Conference Board (http://www.tcb-indicators.org)
Composite Indexes • It’s hard to use 250 indicators, as each reflects different parts of the economy • Need aggregated indexes • Composite Indexes: Weighted averages of a group of indexes that are selected according to a set of criteria. Summary Measures. • Designed to signal changes in the direction of aggregate activity
Index of Leading Indicators • Avg. wkly hrs, manufacturing .181 • Avg wkly initial claims for unemp ins .025 • Manufacturers' new orders, cons gds and mats .049 • Vendor perf, slower deliveries diffusion index .027 • Manufacturers' new orders, nondefense cap gds .013 • Building permits, new private housing units .018 • Stock prices, 500 common stocks .032 • Money supply, M2 .308 • Int rate spread, 10-year T bonds less fed funds .329 • Index of consumer expectations .018
Index of Coincident Indicators • Employees on nonagricultural payrolls .485 • Personal income less transfer payments .274 • Industrial production .131 • Manufacturing and trade sales .110
Index of Lagging Indicators • Average duration of unemployment .038 • Inventory/sales ratio, mfg & trade .122 • Labor cost per unit of output, mfg .062 • Average prime rate .243 • Commercial and industrial loans .130 • Cons. installment credit / pers inc. ratio .218 • Consumer price index for services .187
Diffusion Indexes • Indicators - even those in the Composite Indexes - do not consistently move together • Hard to draw conclusions by watching the ups and downs of many indexes • Diffusion Indexes: Measure the relative strengths of the momentum of expansions and contractions in a group of indicators • % of the indicators in any group that rises during a given time span
How to Compute a Diffusion Index • See the Conference Board web site for details
Forecasting with Composite Indexes: Pro’s and Con’s • Advantages: • Use is straightforward • Reliable • Free • Shortcomings: • Directional forecast only • Short-run (10-12 months) • “Measurement Without Theory”
Survey Data • Based on the concept that you can find out what will happen by going out and asking people what they think will happen • Two kinds: • Public Opinion Surveys • Expert Surveys
Public Opinion Surveys • Typically based on groups of randomly selected individuals from a specific category: Consumers, Investors, Voters, etc. • Collected by different methods • Accuracy depends on size of sample and how representative the sample is of the underlying population • Visible in media: Polls
Forward Data • Public Opinion Polls used in economics • Surveys of people’s opinions about the future • Consumer Purchases: University of Michigan Survey Research Center (Index of Consumer Sentiment) • Business Expenditures: BEA-SEC Survey, part of the Annual Capital Expenditures survey
Expert Surveys • Survey expert opinions about the future • Well-known surveys • ASA-NBER/SPF: Now run by Philadelphia FED, called Survey of Professional Forecasters • NABE Consensus Forecast • Blue Chip Economic Indicators • Livingston Survey: Survey of Economists, also run by Philadelphia FED. Biannual
Forecast Surveys: Advantages • Easy to use, does not involve advanced theory or econometric techniques • Provide both direction and quantitative results
Forecast Surveys: Disadvantages • Accuracy depends on panel • Judgmental
Exercise: Evaluating the Composite Coincident Index • P. 370: “The National Bureau defined that a peak is reached if the next three months are all downward; a trough is reached if the next three months are all upward.” • How reliable is this as a forecast of turning points in the reference cycle? • How often does the reference cycle peak close to peaks in the Indicators?
Exercise: Step 1 • Copy the contents of coincident.txt into Excel and convert it to cells. • This contains dates, the Composite Index of Coincident Indicators, and: • Peak = 1 at reference cycle peaks • Trough = 1at reference cycle troughs • Expan = 1 during expansions • Reces = 1 during recessions
Exercise: Step 2 • Insert a new column to the right of “Coincident” • Label “Delta Coincident” • Write a formula calculating change in coincident
Exercise: Step 3 • Insert a new column to the right of “Delta CC” • Label it “Delta CC 3” • Write a formula using the logical functions “If” and “And” so that this column = 1 if “Delta CC” = 1 for 3 consecutive months • Sum up “Delta CC 3” What does this tell you?
Exercise: Step 4 • We now know how often the Composite Index of Coincident Indicators turned down for three consecutive months • Want to find out how often a peak happened near these events. • Define near
Exercise: Step 5 • Let near be +/- three months. • Construct a logical variable that is equal to 1 if Delta CC 3 equals 1 and Peak = 1 in any of the three months before or after Delta CC3 • Sum this up
Formula • Column E: Delta CC 3 • Column F: Peak • In Row 6: =IF(AND(E6=1,OR(F3=1,F4=1,F5=1,F6=1,F7=1,F8=1,F9=1)),1,0)
Exercise: Evaluation • How many times was the formula =1? • How many peaks in the sample? • How many times did CC turn down for three consecutive months? • Is this an “overestimate”? • Correction?