LINK BUDGET
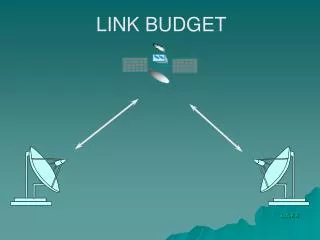
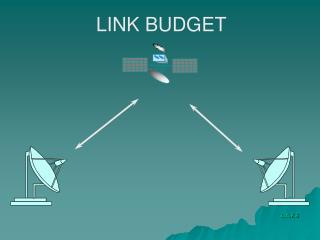
LINK BUDGET. LINK BUDGET. Introduction: A satellite link is defined as an Earth station - satellite - Earth station connection. The Earth station - satellite segment is called the uplink and the satellite - Earth station segment is called the downlink.

LINK BUDGET
E N D
Presentation Transcript
LINK BUDGET • Introduction: • A satellite link is defined as an Earth station - satellite - Earth station connection. The Earth station - satellite segment is called the uplink and the satellite - Earth station segment is called the downlink. • The Earth station design consists of the Transmission Link Design, or Link Budget, and the Transmission System Design. • The Link Budget establishes the resources needed for a given service to achieve the performance objectives.
LINK BUDGET • Performance objectives for digital links consist of: • BER for normal operating conditions • Link Availability, or percentage of time that the link has a BER better than a specified threshold level
LINK BUDGET • The satellite link is composed primarily of three segments: • (i) the transmitting Earth station and the uplink media; • (ii) the satellite; and • (iii) the downlink media and the receiving Earth station. • The carrier level received at the end of the link is a straightforward addition of the losses and gains in the path between transmitting and receiving Earth stations.
LINK BUDGET • The basic carrier-to-noise relationship in a system establishes the transmission performance of the RF portion of the system, and is defined by the receive carrier power level compared to the noise at the receiver input. For example, the downlink thermal carrier-to-noise ratio is: C/N = C -10log(kTB) (1) • Where: • C = Received power in dBW • k = Boltzman constant, 1.38*10-23 W/°K/Hz • B = Noise Bandwidth (or Occupied Bandwidth) in Hz • T = Absolute temperature of the receiving system in °K
LINK BUDGET • The link equation in its general form is: C/N = EIRP - L + G - 10log(kTB) (2) Where: • EIRP = Equivalent Isotropically Radiated Power (dBW) • L = Transmission Losses (dB) • G = Gain of the receive antenna (dB)
LINK BUDGET Equivalent Isotropically Radiated Power: The gain of a directive antenna results in a more economic use of the RF power supplied by the source. Thus, the EIRP is expressed as a function of the antenna transmit gain GT and the transmitted power PT fed to the antenna. EIRPdBW = 10 log PT dBw + GT dBi (3) Where: PT dBw = antenna input power in dBW GT dBi = transmit antenna gain in dBi
LINK BUDGET Equivalent Isotropically Radiated Power: Maximum power flux density at distance r from a transmitting antenna of gain G: ΨM = (G*Ps) / (4πr2) An isotropic (omnidirectional) radiator would generate this flux density EIRP is defined as G*Ps When expressed as dBW, Ps in W, G in dB: EIRP = Ps + G e.g., transmit power of 6 W and antenna gain of 48.2 dB: EIRP = 10 log 6 + 48.2 = 56 dBW Free Space Loss: PR = EIRP + GR - 10 log (4πr/λ)2 (dBW)
Antenna Gain. The antenna gain, referred to an isotropic radiator, is defined by: GdBi = 10log(η)+20log(f)+20log(d)+20.4 dB (4) Where: η = antenna efficiency (Typical values are 0.55 - 0.75) d = antenna diameter in m f = operating frequency in GHz
Transmission losses, generally consist of four components: L = Lo + Latm + Lrain + Ltrack (5) Where: Lo = free Space Loss Latm = atmospheric losses Lrain = attenuation due to rain effects Ltrack = losses due to antenna tracking errors
LINK BUDGET If an isotropic antenna radiates a power PT, the beam power will spread as a sphere in which the antenna is the center. The power at a distance “D” from the transmission point is given by the next equation. W = PT/4πD2. . . . . (W/m2) (6) As the transmit antenna focuses the energy (i.e., has a gain), the equation changes to: W = GTPT/4πD2. . . . . (W/m2) (7)
LINK BUDGET or WdBW/m2 = EIRPdBW - 20 log D – 71 dB (8) Where: GTPT = EIRP W = illumination level D = distance in km 71 dB = 10 log (4π*106)
LINK BUDGET As a receiver antenna 'collects' the signal, the amount of 'collected' signal will depend on the receiver antenna size. The received power PR will be: PR = W*Ae (9) Where: Ae = effective aperture of the receive antenna = (λ2/4π)/GR Then, PR = [GTPT/4πD2]*[(λ2/4π)/GR] (10) PR = GTPT*(λ/4πD)2*GR (11)
LINK BUDGET The expression [4πD/λ]2 is known as the basic free space loss Lo. The basic free space loss is expressed in decibels as: Lo = 20log(D) + 20log(f) + 92.5 dB (12) Where: D = distance in km between transmitter and receiver, or slant range f = frequency in GHz 92.5 dB = 20 log {(4π*109*103)/c}
Free Space Loss FSL = 10 log (4pr/l)2 in dBW , FSL = 32.4 + 20 log r + 20 log ƒ e.g., ES to satellite is 42,000 km, ƒ is 6 GHz, what is FSL? » FSL = 32.4 + 20 log 42000 + 20 log 6000 = 200.4 dB » Very large loss!! e.g., EIRP = 56 dBW, receive antenna gain 50 dB » PR = 56 + 50 - 200.4 = -94.4 dBW = 355 pW • Other sources of losses – Feeder losses – Antenna misalignment losses – Fixed atmospheric and ionospheric losses – Effects of rain • PR = EIRP + GR - Losses, in dBW
Path Loss • Depends on: • Distance and frequency • About 200 dB at C-band • About 206 dB at Ku-band
LINK BUDGET Expressing equation (11) in dB: PRdBW = EIRP - Lo + GR (13) In equation (13), if GR were the gain for a 1m2 antenna with 100 percent efficiency, PR will become the illumination level per unit area in dBW/m2; therefore, the illumination level in equation (8) can also be expressed as: WdBW/m2 = EIRP - Lo + G1m2 (14)
Atmospheric Losses Losses in the signal can also occur through absorption by atmospheric gases such as oxygen and water vapor. This characteristic depends on the frequency, elevation angle, altitude above sea level, and absolute humidity. At frequencies below 10 GHz, the effect of atmospheric absorption is negligible. Its importance increases with frequencies above 10 GHz, especially for low elevation angles.
Atmospheric Losses • Table shows an example of the mean value of atmospheric losses for a 10-degree elevation angle.
Atmospheric Absorption Contributing Factors: – Molecular oxygenConstant – Uncondensed water vapor – Rain – Fog and cloudsDepend on weather – Snow and hail • Effects are frequency dependent – Molecular oxygen absorption peaks at 60 GHz – Water molecules peak at 21 GHz • Decreasing elevation angle will also increaseabsorption loss
Atmospheric Absorption 1% of the time, rain attenuation exceeds 0.3 dB (99% of the time, it is less than or equal to 0.3 dB) 0.5% of the time, it exceeds 0.5 dB 0.1% of the time, it exceeds 1.9 dB
Transmission Losses Up-Link (Geosync) – Up-link ƒ = 6.175 GHz, D = 36,000 km – Path loss is a function of frequency and distance minus transmitter and receiver antenna gain – Loss = 132.7 - 20 log dt - 20 log dr dt transmitter antenna: 30 m dr satellite receiver antenna: 1.5 m – Loss = 132.7 - 29.5 - 3.5 = 94.7 dB Transmitted pwr/received pwr = 2.95 x 10⁹ • Down-Link – Down-link ƒ = 3.95 GHz – Footprint of antenna affects its gain; wide area footprint yields a lower gain, narrow footprint a higher gain – Loss = 136.6 - 20 log dt - 20 log dr Loss = 136.6 - 3.5 - 29.5 = 103.6 dB
Rain Effects • An important climatic effect on a satellite link is the rainfall. Rain results in attenuation of radio waves by scattering and by absorption of energy from the wave. • Rain attenuation increases with the frequency, being worse for Ku-band than for C-band. Enough extra power must be transmitted to overcome the additional attenuation induced by rain to provide adequate link availability.
Tracking Losses When a satellite link is established, the ideal situation is to have the Earth station antenna aligned for maximum gain, but normal operation shows that there is a small degree of misalignment which causes the gain to drop by a few tenths of a dB. The gain reduction can be estimated from the antenna size, the tracking type, and accuracy. • This loss must be considered for the uplink and downlink calculations.
Tracking Losses Earth Station Performance Characteristic (C-band, Antenna Efficiency 70%)
Tracking Losses Earth Station Performance Characteristic (Ku-band, Antenna Efficiency 60%)
System Noise Temperature The system noise temperature of an Earth station consists of the receiver noise temperature, the noise temperature of the antenna, including the feed and waveguides, and the sky noise picked up by the antenna. Tsystem = Tant/L + (1 - 1/L)To + Te (15) Where: L = feed loss in numerical value Te= receiver equivalent noise temperature To= standard temperature of 290°K Tant = antenna equivalent noise temperature as provided by the manufacturer
Noise • Shannon’s Law: B = BN log2 (PR / PN + 1) • Where B = information-carrying capacity of the link (bits/unit bandwidth) • BN = usable bandwidth (hertz) • PR/PN must not get too small! • Noise power usually quoted in terms of noise temperature: PN = k TN BN • The noise temperature of a noise source is that temperature that produces the same noise power over the same frequency range: TN = PN / k BN • Noise density (noise per hertz of b/w): N0 = PN / BN = k TN • Carrier-to-Noise: C/N0 = PR / N0 = PR / k TN : EIRP + G/T - k - Losses in dB • Receiver antenna figure of merit: increases • with antenna diameter and frequency; • More powerful xmit implies cheaper receiver • Sun, Moon, Earth, Galactic • Noise, Cosmic Noise, Sky • Noise, Atmospheric Noise, • Man-made Noise
Noise Sources System Noise – Received power is very small, in picowatts – Thermal noise from random motion of electrons – Antenna noise: antenna losses + sky noise (backgroundmicrowave radiation) – Amplifier noise temperature: energy absorptionmanifests itself as heat, thus generating thermal noise • Carrier-to-Noise Ratio – C/N = PR - PN in dB – PN = k TN BN – C/N = EIRP + GR - LOSSES - k -TS - BN where k is Boltzman’s constant, TS is system noisetemperature, TN is equivalent noise temperature, BN isthe equivalent noise bandwidth – Carrier to noise power density (noise power per unit b/w): C/N0 = EIRP + G/T - Losses - k
Antenna Noise Temperature • The noise power into the receiver, (in this case the LNA), due to the antenna is equivalent to that produced by a matched resistor at the LNA input at a physical temperature of Tant. • If a body is capable of absorbing radiation, then the body can generate noise. Thus the atmosphere generates some noise. This also applies to the Earth surrounding a receiving ground station antenna. If the main lobe of an antenna can be brought down to illuminate the ground, the system noise temperature would increase by approximately 290°K.
Antenna Noise Temperature Noise Temperature of an Antenna as a Function of Elevation Angle
Figure of Merit (G/T) In every transmission system, noise is a factor that greatly influences the whole link quality. The G /TdBK is known as the "goodness" measurement of a receive system. This means that providing the Earth station meets the required G/T specification, INTELSAT will provide enough power from the satellite to meet the characteristic of every service.
Figure of Merit (G/T) G/T is expressed in dB relative to 1°K. The same system reference point, such as the receiver input, for both the gain and noise temperature must be used. G/T = Grx - 10log(Tsys) (16) Where: Grx= receive gain in dB Tsys= system noise temperature in °K
Carrier to Noise Ratio In the link equation, by unfolding the kTB product under the logarithm, the link equation becomes: C/N = EIRP - L+ G - 10log(k) - 10log(T) - 10log(B)(17) The difference, G - 10logT, is the figure of merit: C/N = EIRP - L+ G/T - 10log(k) - 10log(B)(18) Where: L = transmission losses G/T = figure of merit of the receiver k = Boltzmann constant B = carrier occupied bandwidth
Carrier to Noise Ratio Because the receiver bandwidth (B) is often dependent on the modulation format, isolate the link power parameters by normalizing out the bandwidth dependence. The new relation is known as Carrier-to-Noise Density ratio (C/No). C/No = EIRP - L + G/T - 10log(k)(19) Note that: C/N = C/T - 10logkB(20) Expressing C/T as a function of C/N, and replacing C/N with the right side of the link equation, results: C/T = EIRP - L + G/T(21)
Carrier to Noise Ratio The ratio C/No allow us to compute directly the receiver Bit energy-to-noise density ratio as: Eb/No = C/No - 10log(digital rate) (22) The term "digital rate" is used here because Eb/No can refer to different points with different rates in the same modem.
Carrier-to-Noise Ratio Example Calculation – 12 GHz frequency, free space loss = 206 dB, antenna pointing loss = 1 dB, atmospheric absorption = 2 dB – Receiver G/T = 19.5 dB/K, receiver feeder loss = 1 dB – EIRP = 48 dBW • Calculation: – C/N0 = -206 - 1 - 2 + 19.5 - 1 + 48 + 228.6 = 86.1 (Note that Boltzmann’s constant k = 1.38x10⁻²³ J/K = -228.6 dB)
Link Budget The interpretation of equation (21) is that a given C/T required by a certain type of carrier and quality of service, can be obtained for different combinations of EIRP and G/T. EIRP represents the resource usage and finally is reflected in the operating costs because higher satellite EIRP means higher operating costs. On the other hand the G/T represents the capital expenditure, because higher G/T means larger antenna and/or better LNA, reflected in the cost of the equipment.
Link Budget Note that in some cases the Earth station G/T could be improved by using a better LNA. For example, an Earth station with a receive gain of 53 dBi, antenna noise of 25°K at 25° in C-band, feeder noise temperature of 5°K and LNA noise temperature of 80°K would have: G/T = Gant -10log(Tant+Tfeed+TLNA) (23) G/T = 53-10log(25 + 5 + 80) = 32.6 dB/°K This antenna would be classified as a standard B antenna.