Download
1 / 14
180 likes | 438 Views
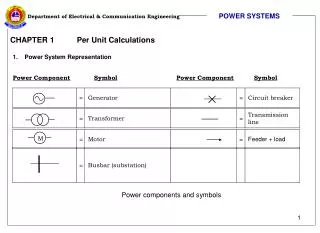
Department of Electrical & Communication Engineering. M. POWER SYSTEMS. CHAPTER 1 Per Unit Calculations. 1. Power System Representation. Power components and symbols . Department of Electrical & Communication Engineering. M. POWER SYSTEMS.

E N D
Department of Electrical & Communication Engineering M POWER SYSTEMS CHAPTER 1 Per Unit Calculations 1. Power System Representation Power components and symbols
Department of Electrical & Communication Engineering M POWER SYSTEMS Interconnections among these components in the power system may be shown is a so-called one-line diagram or single-line diagram. Single-line diagram represents all 3- of balanced system. For the purpose of analysis, the single-line diagram of a particular power system network is represented to its equivalent reactance or impedance diagram. A sample of a interconnected of individual power component is shown in Figure 1.1. This represent a circuit diagram of a power network which is referred to as a single-line diagram. Figure 1.1 – Single-line diagram
Department of Electrical & Communication Engineering POWER SYSTEMS • Impedance diagram • In power system fault calculations it is often that a single-line diagram representing a typical power network in • 3- be converted into its per phase impedance diagram. Some assumptions for converting from single-line • diagram into its equivalent impedance diagram needed to be considered. • A generator can be represented by a voltage source in series with an inductive reactance. The internal • resistance of the generator is assumed to be negligible compared to the reactance. • (ii) The loads are usually inductive represented by resistance and inductance. • (iii) The transformer core is assumed to be ideal, and the transformer may be represented by a reactance only. • (iv) The transmission line is represented by its resistance and inductance, the line-to-ground capacitance is assumed to be negligible. Let us consider the following on how the single-line diagram of Figure 1.2 converted into its impedance diagram counterpart.
Department of Electrical & Communication Engineering Station B Station A Transmission Line TL Generator G1 Transformer T2 Transformer T1 G3 G2 G4 Load L1 Load L2 POWER SYSTEMS Figure 1.2 – Single-line diagram of a power network
Department of Electrical & Communication Engineering Transmission Line TL Transformer T1 Transformer T2 Station B Station A j XT1 j XT2 j XTL RTL RL1 j X1 j X3 j X4 RL2 j X2 G3 G4 G1 j XL2 G2 j XL1 POWER SYSTEMS Figure 1.3 – Impedance diagram of Figure 1.2
Department of Electrical & Communication Engineering POWER SYSTEMS Per-Unit Quantities Per unit quantities are quantities that have been normalized to a base quantity. In general, per-unit (p.u) Choice of the base value Zbaseis normally a rated value which is often one of the normal full-load operations of power component in a power network. Let us look at two of the most common per unit formula which are widely used when per unit calculations are involved. (i) Base impedance (Zbase) For a given single-line (one-line) diagram of a power network, all component parameters are expressed in 3- quantity whether it is the rating (capacity) expressed as MVA or voltage as kV. Let begin with 3- base quantity of ----- (i) where Vbase = line voltage, Ibase= line or phase current Per phase base impedance, -----(ii) This is line-to-neutral impedance
Department of Electrical & Communication Engineering POWER SYSTEMS Combining (i) and (ii) yields, where kVbase and MVAbaseare 3- qualtities (ii) Changing base impedance (Znew] Sometimes the parameters for two elements in the same circuit (network) are quoted in per-unit on a different base. The changing base impedance is given as,
Department of Electrical & Communication Engineering 100 MVA 275 kV/132 kV 50 MVA 132 kV/66 kV 5 MVA Xg = 16% Transmission line j 3.48 p.u. p.u. XT2 = 0.04 p.u Load 40 MW, 0.8 p.f. lagging XT1 = 0.1 p.u POWER SYSTEMS Example 1 Determine the per-unit values of the following single-line diagram and draw the impedance diagram. Solution: Chosen base: Always choose the largest rating, therefore Sbase = 100 MVA, V = 66 kV, 132 kV and 275 kV Per-unit calculations: Generator G1: Transformer T1:
p.u. p.u. POWER SYSTEMS Department of Electrical & Communication Engineering Transmission line TL: Transformer T2: p.u. Inductive load:
Transmission Line TL Transformer T2 Transformer T1 100 MVA 275 kV/132 kV 50 MVA 132 kV/66 kV 5 MVA Xg = 16% Transmission line j 3.48 j 0.08 p.u. j 0.1 p.u. j 0.0195 p.u. j 0.32 p.u. 1.6 p.u.. Generator G j 1.2 p.u. XT2 = 0.04 p.u Load 40 MW, 0.8 p.f. lagging XT1 = 0.1 p.u POWER SYSTEMS Department of Electrical & Communication Engineering Now, we have all the impedance values in per-unit with a common base and we can now combine all the impedances and determine the overall impedance. Load
POWER SYSTEMS Department of Electrical & Communication Engineering
POWER SYSTEMS Department of Electrical & Communication Engineering Load
POWER SYSTEMS Department of Electrical & Communication Engineering Summarise: Load
POWER SYSTEMS Department of Electrical & Communication Engineering Load