Impact of Methyl Viologen and Nigericin on NPQ and Photoinhibition in pgr5 Mutants
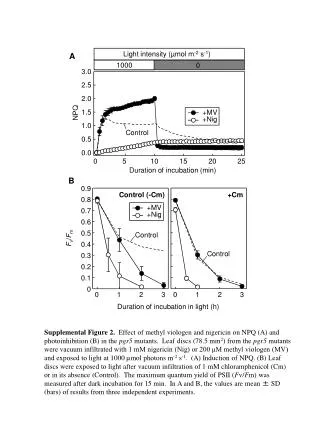
This study explores the effects of methyl viologen (MV) and nigericin (Nig) on non-photochemical quenching (NPQ) and photoinhibition in pgr5 mutant leaf discs, using a light intensity of 1000 µmol photons m-2 s-1. The leaf discs were infiltrated with 1 mM nigericin or 200 µM methyl viologen, followed by exposure to light. Changes in NPQ induction and maximum quantum yield of PSII (Fv/Fm) were measured after a dark incubation period. Data are presented as mean ± SD from three independent experiments.

Impact of Methyl Viologen and Nigericin on NPQ and Photoinhibition in pgr5 Mutants
E N D
Presentation Transcript
Light intensity (µmol m-2 s-1) 1000 0 +MV +Nig +MV +Nig A 3.0 2.5 2.0 NPQ 1.5 1.0 Control 0.5 0.0 0 5 10 15 20 25 Duration of incubation (min) B 0.9 Control (-Cm) +Cm 0.8 0.7 0.6 Control 0.5 Fv/Fm 0.4 Control 0.3 0.2 0.1 0 0 1 2 3 0 1 2 3 Duration of incubation in light (h) Supplemental Figure 2. Effect of methyl viologen and nigericin on NPQ (A) and photoinhibition (B) in the pgr5 mutants. Leaf discs (78.5 mm2) from the pgr5 mutants were vacuum infiltrated with 1 mM nigericin (Nig) or 200 μM methyl viologen (MV) and exposed to light at 1000 µmol photons m-2 s-1. (A) Induction of NPQ. (B) Leaf discs were exposed to light after vacuum infiltration of 1 mM chloramphenicol (Cm) or in its absence (Control). The maximum quantum yield of PSII (Fv/Fm) was measured after dark incubation for 15 min. In A and B, the values are mean ± SD (bars) of results from three independent experiments.