Download
1 / 27
270 likes | 343 Views
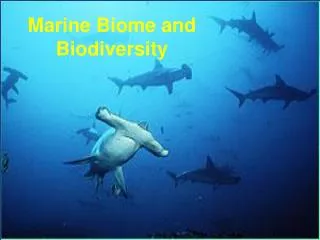
Comparison of dispersal in two sea stars, Linckia laevigata and Protoreaster nodosus , across a known geographic barrier. Martha Muñoz, Bola Akinronbi, and Paul Barber (BUMP). Indonesia is the center of marine biodiversity. Fish Corals Snails. Coastal margins during glacial maxima.

E N D
Comparison of dispersal in two sea stars, Linckia laevigata and Protoreaster nodosus, across a known geographic barrier. Martha Muñoz, Bola Akinronbi, and Paul Barber (BUMP)
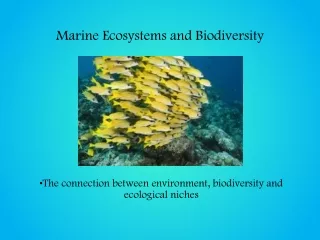
Indonesia is the center of marine biodiversity Fish Corals Snails
Coastal margins during glacial maxima Pleistocene Sea Level Fluctuations After Voris 2002 400km
Duke et al. 1999 Lavery et al. 1996 Williams & Benzie, Benzie & Williams 1997 McMillan & Palumbi 1996
GOALS • To examine the genetic structure of Linckia laevigata across a broad geographic scale and refine the location of a biogeographic break. • To determine the degree of similarity genetic structure between Linckia laevigata and Protoreaster nodosus, which have similar larval pelagic dispersals.
F-statistics • Fst: measure of genetic divergence by examining allelic content. • Ranges from 0-1. • “0” means there is no genetic difference between sub- and total population. • “1” means the sub- and total population are not related at all. • It is used to infer gene flow.
Methods I. Sampling Sulawesi Java Papua Halmahera
Methods I. Sampling in the field- Collected 377 Linckia and 115 Protoreaster from 23 localities. II. DNA extractions were performed using a 10% Chelex solution and samples were incubated overnight. III. Amplifications of mitochondrial CO-1 were performed and fragments varying from 658 to 890 base pairs were isolated.
Methods IV. Isolated CO-1 fragments were sequenced on an ABI 377 using ddNTP terminator chemistry V.Resulting fragments were proofread using Sequencher software and fragment alignments were visually made. VI. Minimum-spanning trees and F-statistics were determined using Arlequin software.
Linckia laevigata Minimum Spanning Tree Black Clade White Clade Gray Clade Clades were separated by 8 mutational steps.
Results Linckia laevigata Relative Clade Distribution
Protoreaster Haplotype Network White Clade Black Clade Gray Clade
Linckia Protoreaster
West East
Fst and Genetic Variance Between Indian and Pacific Ocean Populations of Linckia
Fst and Genetic Variance Between Indian and Pacific Ocean Populations of Protoreaster
Conclusions High diversity in haplotypes with some regional differentiation of clades. Protoreaster Linckia
Conclusions Three major clades among Linckia and Protoreaster. Star phylogenies suggest recent range expansions. Protoreaster Linckia
Conclusions Variation across a geographic gradient is positively orrelated between Protoreaster and Linckia. These similar taxa disperse and exchange genes in similar patterns.
Broader Implications Similar taxa, such as Linckia and Protoreaster can display similar patterns of dispersal. Marine protected areas require ranges large enough to ensure adequate gene flow.
Acknowledgments Thank you to Paul Barber, Bolanle Akinronbi, Elizabeth Jones, and Eric Crandall for support both in the laboratory and in the field. NSF for funding