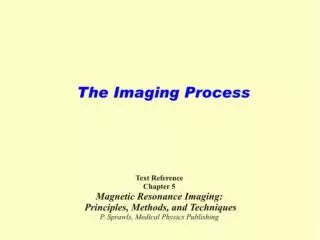
Analysis of T1 and T2 Values in Various Tissues for MRI Imaging
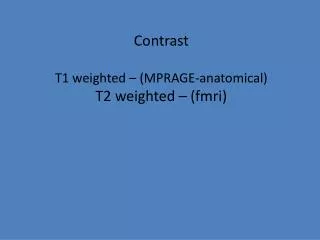
This document details the relaxation times (T1 and T2) for several tissues as observed in MRI imaging at different magnetic field strengths (0.5T and 1.5T). Key values include T1 and T2 for fat, liver, white matter, gray matter, and cerebrospinal fluid (CSF). The data is crucial for understanding tissue contrast in imaging, focusing on the range of T1 values from 80 to 1800 ms and T2 values from 42 to 2400 ms. Such insights are essential for diagnostic applications and enhancing MRI technique efficacy.

Analysis of T1 and T2 Values in Various Tissues for MRI Imaging
E N D
Presentation Transcript
Tissues T1 @ 0.5T T1 @ 1.5T T2 T1 and T2 Values FAT 80 102 250 LIVER 350 500 42 WHITE M. 500 90 780 650 GRAY M. 920 100 CSF 1800 2400 160
Tissues T1 @ 0.5T T1 @ 1.5T T2 T1 and T2 Values FAT 80 102 250 LIVER 350 500 42 WHITE M. 500 90 780 650 GRAY M. 920 100 CSF 1800 2400 160
Tissues T1 @ 0.5T T1 @ 1.5T T2 T1 and T2 Values FAT 80 102 250 LIVER 350 500 42 WHITE M. 500 90 780 650 GRAY M. 920 100 CSF 1800 2400 160
T1 and T2 Values FAT 80 102 250 LIVER 350 500 42 WHITE M. 500 90 780 650 GRAY M. 920 100 CSF 1800 2400 160