Download
1 / 1
10 likes | 82 Views
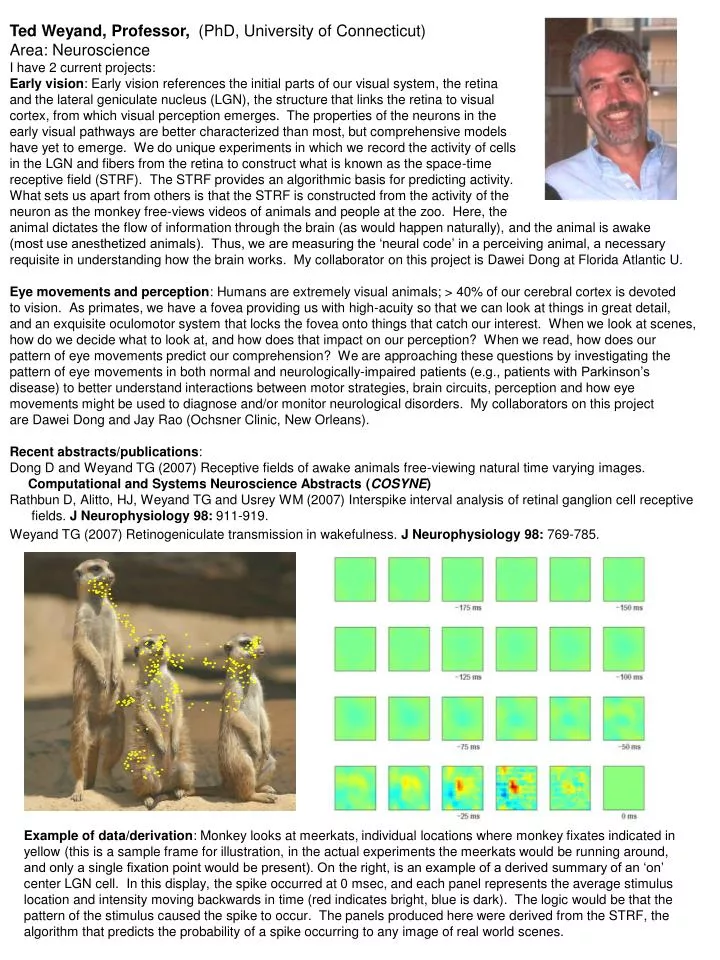
Ted Weyand, Professor, (PhD, University of Connecticut) Area: Neuroscience I have 2 current projects: Early vision : Early vision references the initial parts of our visual system, the retina and the lateral geniculate nucleus (LGN), the structure that links the retina to visual

E N D
Ted Weyand, Professor, (PhD, University of Connecticut) Area: Neuroscience I have 2 current projects: Early vision: Early vision references the initial parts of our visual system, the retina and the lateral geniculate nucleus (LGN), the structure that links the retina to visual cortex, from which visual perception emerges. The properties of the neurons in the early visual pathways are better characterized than most, but comprehensive models have yet to emerge. We do unique experiments in which we record the activity of cells in the LGN and fibers from the retina to construct what is known as the space-time receptive field (STRF). The STRF provides an algorithmic basis for predicting activity. What sets us apart from others is that the STRF is constructed from the activity of the neuron as the monkey free-views videos of animals and people at the zoo. Here, the animal dictates the flow of information through the brain (as would happen naturally), and the animal is awake (most use anesthetized animals). Thus, we are measuring the ‘neural code’ in a perceiving animal, a necessary requisite in understanding how the brain works. My collaborator on this project is Dawei Dong at Florida Atlantic U. Eye movements and perception: Humans are extremely visual animals; > 40% of our cerebral cortex is devoted to vision. As primates, we have a fovea providing us with high-acuity so that we can look at things in great detail, and an exquisite oculomotor system that locks the fovea onto things that catch our interest. When we look at scenes, how do we decide what to look at, and how does that impact on our perception? When we read, how does our pattern of eye movements predict our comprehension? We are approaching these questions by investigating the pattern of eye movements in both normal and neurologically-impaired patients (e.g., patients with Parkinson’s disease) to better understand interactions between motor strategies, brain circuits, perception and how eye movements might be used to diagnose and/or monitor neurological disorders. My collaborators on this project are Dawei Dong and Jay Rao (Ochsner Clinic, New Orleans). Recent abstracts/publications: Dong D and Weyand TG (2007) Receptive fields of awake animals free-viewing natural time varying images. Computational and Systems Neuroscience Abstracts (COSYNE) Rathbun D, Alitto, HJ, Weyand TG and Usrey WM (2007) Interspike interval analysis of retinal ganglion cell receptive fields. J Neurophysiology 98: 911-919. Weyand TG (2007) Retinogeniculate transmission in wakefulness. J Neurophysiology 98: 769-785. Example of data/derivation: Monkey looks at meerkats, individual locations where monkey fixates indicated in yellow (this is a sample frame for illustration, in the actual experiments the meerkats would be running around, and only a single fixation point would be present). On the right, is an example of a derived summary of an ‘on’ center LGN cell. In this display, the spike occurred at 0 msec, and each panel represents the average stimulus location and intensity moving backwards in time (red indicates bright, blue is dark). The logic would be that the pattern of the stimulus caused the spike to occur. The panels produced here were derived from the STRF, the algorithm that predicts the probability of a spike occurring to any image of real world scenes.