Beverage Control
Beverage Control. chapter 7. Opening Question. What control concepts have we studied so far that crossover easily to beverages?. Both use standard recipes. Both require quality and quantity standards. Both require menu prices that cover cost per portion and a contribution margin.

Beverage Control
E N D
Presentation Transcript
Beverage Control • chapter 7
Opening Question What control concepts have we studied so far that crossover easily to beverages? • Both use standard recipes. • Both require quality and quantity standards. • Both require menu prices that cover cost per portion and a contribution margin. • Both can have costs tracked as a percent of sales.
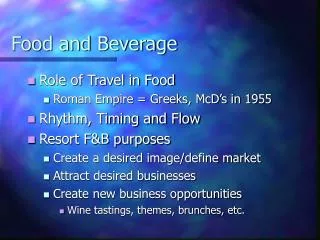
Some Key Differences for Beverages Differences Different beverages require different glassware (presentation and portion control) Beverage recipes allow for flexibility in brands per the customer’s request
Types of Bars Front Bars • In the public view. • Display call brands. Service Bars • Prepare drinks behind the scenes. • May only have well brands. Catering Bars • For special events. • May offer a very limited liquor selection.
Beverage Yields • Wine and beer sold by the bottle have a yield of 100% • Y% = yield in oz ÷ oz in original container Yield percent accounts for evaporation and spillage and is calculated by seeing how many ounces or drinks a container yields.
Example 7a On average, each 15 Gal keg yields 108 pints of beer. What is Y% for the beer kegs in this operation? • Yield in oz = 108 pt X 16 oz/pt • = 1728 oz • AP oz = 15 Gal X 128 oz/Gal – 1920 • Y% = Yield in oz ÷ AP oz • = 1728 oz ÷ 1920 oz • = 0.9 or 90% 7
Calculating Cost per Portion for a Single Liquid Beverage • Convert AP$ (from invoice) to units that match EP portion size • Calculate EP$ = AP$ ÷ Y% • Cost per portion = EP portion size X EP$
Example 7b What is the cost per portion for 1 ¼ oz shot of tequila that costs $17.50/750 mL bottle and has a yield percent of 94.7%? • $17.50/750mL X 1000mL/L X 1L/33.8oz • = $0.69/oz • EP$ = $0.69/oz ÷ 0.947 • = $0.729/oz • Cost per portion = 1.25 oz X $0.729/oz • = $0.91/shot
Costing Multi-Ingredient Beverages • The spreadsheet is identical to the one used for food recipes, except… • BC% replaces FC% (conceptually the same but often different numbers in the operation) • SF% may or may not apply • There is no Q Factor When costing multi-ingredient beverages, you must use a recipe costing spreadsheet.
Determining Sales Prices Determining the sales price is the same process as for food. The food cost method is the most common approach.
Determining Sales Prices BC SP x BC% BC= Beverage Cost
Example 7d • SP = BC ÷ BC% • = $0.92 ÷ 0.18 • = $5.11 A cocktail costs $0.92/portion. The bar runs a BC% of 18%. What should the selling price be?
Beverage Cost Percent Use BC% to monitor compliance with company quality and quantity standards. • Often tracked separately for beer, wine, liquor, and non-alcoholic drinks • BC% usually lower than FC% • Biggest challenge in tracking BC% is that the same liquid earns different amounts of money depending on how it is sold
Three Methods for Reconciling Alcohol Standard vs. Actual Costs and Sales Cost Method Sales Value Method Liquid Measure Method
The Cost Method • Conduct a physical storeroom inventory. • Inventory the bar as well. • Compare cost of beverages sold to beverage sales to get beverage cost percent. The Cost Method is similar to tracking food cost:
Cost Method: Cost of Food Sold Step One Opening Inventory + Purchases - Closing Inventory + Transfers In - Transfers Out - Promotions and Write-Offs Cost of Beverages Issued (from storeroom)
Cost Method: Cost of Food Sold Step Two Bar Inventory Differential = Opening Bar Inventory – Closing Bar Inventory • Accuracy of the differential depends on how one measures the contents of each open bottle at the bar. • Measure partials by eye, by ruler, or by scale. • Differential may be positive or negative.
Cost Method: Cost of Food Sold Step Three Cost of Beverages Sold = Cost of Beverages Issued + Bar Inventory Differential • If differential is negative, it results in the number being subtracted.
Cost Method: Cost of Food Sold Step Four Beverage Cost % (BC%) = Cost of Beverages Sold (BC) ÷ Beverage Sales • BC% can be done separately for beer, wine, liquor, and non-alcohol by calculating each category’s cost and sales totals separately
Cost Method • Using the cost method, each category’s BC% should remain relatively consistent from month to month; OR • Use sales records and recipe costing sheets to determine standard beverage cost for that month. Actual and standard cost (or actual and standard BC%) should be fairly close
Example 7e The data set on the next slide is from a restaurant bar. Calculate cost of beverages sold and BC% for this operation.
Example 7e • opening storeroom inventory = $38,740 • closing storeroom inventory = $35,490 • purchases = $71,750 • transfers in = $860 • transfers out = $1,730 • promotions = $220 • bar opening inventory = $1,270 • bar closing inventory = $1,430 • total bar beverages sales = $381,400.
Example 7e (cont.) Cost of beverages issued = $38,740 + $71,750 - $35,490 + $860 - $1,730 - $220 = $73,910 Bar differential = $1,270 - $1,430 = (-160) Cost of beverages sold = $73,910 + (-$160) = $73,750 BC% = $73,750 ÷ $381,400 = 19.3%
The Liquid Measure Method The Liquid Measure Method counts liquor, not dollars. • Use sales data and recipes to calculate how many oz of each liquor should have been consumed in prior period. • Requires scale to measure partial bottles. • Save empty bottles to track used bottles. • Easier with automated dispensers.
The Sales Value Method In the Sales Value Method, the manager compares money that should have been made in sales from each bottle of alcohol to actual sales during the period. • Challenge lies in that the same alcohol can sell for different prices based on how it is sold (shots vs. cocktails; mugs vs. pitchers, etc.)
Sales Value Method To account for varied sales values: • Make an adjustment to standard sales totals based on the actual drinks sold; add or subtract the extra sales dollars made or lost for each drink sold differently from a shot or bottle • Base the expected sales value on the bar’s historical average sales for that value (not menu price); remains constant over time if menu mix does not change. Compare expected to actual.
Sales Value Method • 3. Calculate a standard deviation from sales for each category of alcohol. Calculate potential sales value of inventory used assuming all liquor sold as shots, wine as bottles, beer as glasses. Compare potential sales value to actual sales totals and determine the percent difference. This difference should remain constant month to month with constant sales mixes.
Universal Method Response No matter which method is used, managers should investigate any unacceptable variances between standard and actual data • Investigation may reveal improper measuring, giving away drinks, or off-the-record sales.
Portion Control and Glassware • Most drinks are paired with a specific glass and filled to the rim, so it is impossible to over-pour • Right glassware makes the portion look large while controlling portion size • Wine is the exception as it is not filled to the top of a wine glass. To control, pour into another measurement container first and then pour into the wine glass. (Aerates wine, too!)
Alcohol Laws and Ethics • All restaurants and bars need licenses to sell alcohol. When licenses are limited by the state, restaurants may adopt a “bring your own” policy. License State: U.S. State that issues licenses to purveyors to sell alcohol to bars/restaurants Control State: U.S. State that operates all liquor stores itself (no competition) vs.
Alcohol Laws and Ethics • Cannot sell legally to minors or intoxicated guests; risks loss of license • To maximize profit, push quality, not quantity • Upselling is encouraging guests to purchase higher quality alcohol for a drink • Dram shop laws:laws that allow the victim of an alcohol-related accident to sue the business and server who sold alcohol to the perpetrator of the accident.
Common Forms of Theft at Bars • Improper measuring • Controlled with pourers, automated dispensing machines, proper glassware. • Giveaways • Controlled with integrated beverage systems. • Inaccurate Charging • Controlled with POS systems.
Common Forms of Theft at Bars • Playing with the Cash Register • Do not allow bartenders to leave the cash drawer open • Keep tip jar away from register; use POS system • Give each bartender a separate cash drawer that only the manager closes out • Swap cash drawers mid-shift to see if they match the register
Common Forms of Theft at Bars • Playing with the Inventory • Controlled with automated dispensing systems. • Bottles marked with a stamp to spot unauthorized bottles. • Maximum par stock at the bar. • Forbidding employee bags or coats behind the bar. • Using a bottle exchange system (return empties to get new bottles). • Requiring employee to sign for requisition at pick-up.
Non-Alcoholic Beverages • Good sources of profit. • When costing, include common add-on’s (honey, sugar, milk, etc.) and assume an average number of refills. • Maintain quality and quantity standards for production, storage, and portion size as with any other product. • Control which beverages employees may consume for free on site.