Download

1 / 1
10 likes | 175 Views
Brigantine Nat’l Wildlife Refuge: Nov. 4 – 30, 2003 ( n = 13). Bondville, Illinois: February 1 – 28, 2003 ( n = 13). Mass concentration dM/dlnD p ( μ g/m 3 ). Mass concentration dM/dlnD p ( μ g/m 3 ). San Gorgonio Wilderness Area: April 4 – 27, 2003 ( n = 12). SO 4 =. SO 4 =. SO 4 =.

E N D
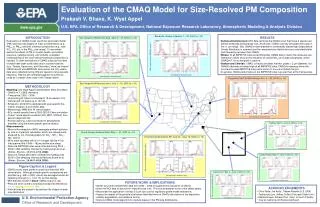
Brigantine Nat’l Wildlife Refuge: Nov. 4 – 30, 2003 (n = 13) Bondville, Illinois: February 1 – 28, 2003 (n = 13) Mass concentration dM/dlnDp (μg/m3) Mass concentration dM/dlnDp (μg/m3) San Gorgonio Wilderness Area: April 4 – 27, 2003 (n = 12) SO4= SO4= SO4= SO4= SO4= SO4= NH4+ NH4+ NH4+ NH4+ NH4+ NH4+ NO3- NO3- NO3- NO3- NO3- NO3- Aerodynamic diameter (μm) Aerodynamic diameter (μm) Mass concentration dM/dlnDp (μg/m3) Na+ Na+ Na+ Na+ Na+ Na+ Cl- Cl- Cl- Cl- Cl- Cl- San Gorgonio Wilderness Area: July 1 – 30, 2003 (n = 14) Aerodynamic diameter (μm) Mass concentration dM/dlnDp (μg/m3) Sydney: May 4 – June 2, 2002 (n = 14) Aerodynamic diameter (μm) Mass concentration dM/dlnDp (μg/m3) Aerodynamic diameter (μm) Grand Canyon National Park: May 1 – 31, 2003 (n = 15) Great Smoky Mountains NP: July 22 – Aug. 19, 2004 (n = 14) Gandy Bridge: May 4 – June 2, 2002 (n = 15) Mass concentration dM/dlnDp (μg/m3) Mass concentration dM/dlnDp (μg/m3) Azalea Park: May 4 – June 2, 2002 (n = 15) Mass concentration dM/dlnDp (μg/m3) SO4= SO4= SO4= NH4+ NH4+ NH4+ NO3- NO3- NO3- Aerodynamic diameter (μm) Mass concentration dM/dlnDp (μg/m3) Aerodynamic diameter (μm) Na+ Na+ Na+ Cl- Cl- Cl- Aerodynamic diameter (μm) Aerodynamic diameter (μm) Evaluation of the CMAQ Model for Size-Resolved PM Composition Prakash V. Bhave, K. Wyat Appel U.S. EPA, Office of Research & Development, National Exposure Research Laboratory, Atmospheric Modeling & Analysis Division INTRODUCTION Evaluations of CMAQ model results for particulate matter (PM) have focused largely on mass concentrations (e.g., PM2.5 or PM10) and bulk chemical composition (e.g., total SO4, OC, etc. in the PM2.5 size range). To accurately assess the effects of PM on human health, ecosystem exposure, radiative forcing, and visibility, a detailed understanding of the size-resolved chemical composition is needed. To date, evaluations of CMAQ output at that level of detail have been conducted only in coastal locations (e.g., Tampa, Vancouver, and Shenzhen). Here, we inspect CMAQ results at 6 IMPROVE sites across the U.S. where data were collected during different seasons using cascade impactors. Results are contrasted against our previous study at 3 coastal urban sites in the Tampa region. • RESULTS • Sulfate and Ammonium: MOI data reinforce the CMAQ result that these 2 species are almost identically distributed by size. At all sites, CMAQ correctly simulates their peak in the <1 μm range. But, CMAQ’s mean diameter is consistently biased high (especially at Smoky Mountains in summer) and the measured size distributions are consistently taller and frequently narrower than CMAQ. • Nitrate: At all IMPROVE sites except Bondville, CMAQ fails to match the observed size distribution. MOIs show some indication of coarse NO3 on crustal/soil particles, which CMAQv4.7 is not designed to capture. • Sodium and Chloride: CMAQ correctly simulates that Na+ peaks > 2 μm diameter, but CMAQ’s diameter is biased high at all IMPROVE sites. CMAQ is missing a minor Na+ source at several IMPROVE sites and a minor Cl- source at Grand Canyon. • In general, CMAQ performance at the IMPROVE sites is poorer than at the Tampa sites. • METHODOLOGY • Modeling: see Wyat Appel’s presentation Wed. at 8:30am • CMAQ v4.7, CB05 chemistry • Time period: 2002 – 2006 • Horizontal grid: 36 km continental & 12 km eastern U.S. • Vertical grid: 24 layers up to 100 mb • Emissions: 2002 NEI substituted with year-specific fire, mobile, biogenic, & point EGU data • Meteorology: MM5 with 34 vertical layers • BCs: month-specific from a 2002 GEOS-Chem simulation • Output: mode-specific variables (DG_WET, STDEV) from aerosol diagnostic file • Post-processing: output converted to aerodynamic diameter using the mode-specific particle density • Measurements: • Micro-orifice impactors (MOI) segregate ambient particles by size on impaction substrates, which are subsequently analyzed by ion chromatography for SO4=, NH4+, NO3-, Na+, and Cl-. • MOIs were operated with 8 or 10 stages (dlnDp ≈ 0.6), that spanned the 0.056 – 18 μm particle size range. • Data at 6 IMPROVE sites were collected during 2003 – 2004 in 48h sampling intervals by Taehyoung Lee et al. (Atmos. Environ., 42:2720-2732, 2008). • Data at 3 Tampa sites were collected during May/June 2002 in 23h sampling intervals by Melissa Evans et al. (Atmos. Environ., 38:4847-4858, 2004). Tampa Bay area • Figure Caption & Legend • CMAQ results were paired in space and time with MOI observations. Although sample-specific comparisons are possible (e.g., 48h or 23h), results are averaged across all sampling intervals (n = 12 to 15) for this display. • MOI data are shown in black; CMAQ output in red. • Plots are color-coded to emphasize seasonal differences: winter, spring, summer, fall. • Vertical axes are scaled to accentuate the shapes of each size distribution • FUTURE WORK & IMPLICATIONS • Gather any other ambient MOI data from 2002 – 2006 to augment this evaluation of CMAQ. • Invert the MOI data to account for imperfect size cuts. This should dampen some of the tallest peaks. • Reconsider the application of sharp 2.5 μm size cuts for regulatory-grade model evaluations. • Assess the impact of the particle-size biases identified here on CMAQ calculations of dry deposition, visibility degradation, and radiative forcing. • Improve CMAQ model algorithms to reduce biases in the PM size distributions. • ACKNOWLEDGEMENTS • Chris Nolte, Jim Kelly*, Shawn Roselle (U.S. EPA) • Taehyoung Lee, Jeffrey Collett (Colorado State Univ.) • Melissa Evans, Noreen Poor (Univ. of South Florida) • * now at California Air Resources Board U.S. Environmental Protection Agency Office of Research and Development