Download
1 / 22

E N D
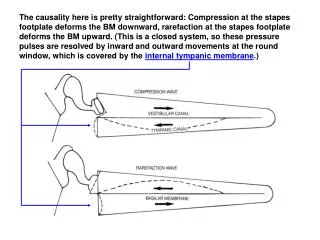
The causality here is pretty straightforward: Compression at the stapes footplate deforms the BM downward, rarefaction at the stapes footplate deforms the BM upward. (This is a closed system, so these pressure pulses are resolved by inward and outward movements at the round window, which is covered by the internal tympanic membrane.)
f = 3,000 Hz f = 300 Hz f = 1,000 Hz Note that differences in frequency can be seen in two ways: (1) by differences in the place along the BM with the greatest motion amplitude (this will become the basis of Place Theory/the Place Principle/Tonotopic Theory); (2) by differences in the rate at which the BM vibrates (this will become the basis of Synchrony Theory).
Suppose we were to mix two sinusoids together – one low frequency (e.g., 200 Hz) and the other of much higher frequency (e.g., 3000 Hz). What kind of traveling wave envelope pattern would we expect to see on the basilar membrane? 200 Hz, 3000 Hz 200 Hz + 3000 Hz
3000 Hz 200 Hz Figure 4-15. The basilar membrane varies continuously in stiffness from base to apex. The greater stiffness of the membrane at the base makes the basal end respond better to high frequencies than low frequencies, while the opposite is true of the apical end. After von Bekesy (1960), Rhode (1973), and Durrant & Lovrinic (1995).
Output: Individual frequency components have been “unmixed” – low frequencies directed to one spatial location, high frequencies directed to a different spatial location, mid-frequencies directed to the appropriate place in the middle. Input: Complex optical signal with many frequencies mixed together.
What should be happening at the 8th N for two signals that differ in frequency?
FR Curves for 8th N fibers at 2 different locations along the basilar membrane. These 2 nerve fibers are said to have 2 different “characteristic frequencies” (CFs; sometimes called “best frequencies). One fiber responds best (has the highest firing rate) at 900 Hz, the other at 1700 Hz. This has nothing to do with the fiber itself – the differences in CF occur because the 900 Hz fiber is connected to a hair cell that is closer to the apex than the 1700 Hz fiber.The differences in CF are due to the basilar membrane, not the fiber.
On this question of what controls the CF of a fiber, consider this hypothetical question: • Question: Suppose an afferent 8th N with a CF of 125 Hz were to be disconnected from the apical end of the BM and reconnected at the basal end. Now we re-measure the CF of the fiber. What will happen? • The CF remains 125 Hz. Why should it matter where it’s located? If the CF is 125 at the apical end, and it’s really the same fiber (which it is), the CF will remain 125 Hz. • The CF has to change to something much higher because now because the hair cells that stimulate the nerve to fire are connected to a section of the BM that is much stiffer than before (when it was connected at the apex) and therefore will respond best to high frequency vibration. It’s not the fiber that gives a fiber its CF, it’s the stiffness of the section of the BM that it’s attached to. • Not enough information. We need to know the sound level as well as the frequency.
The previous figure showed FR curves for 2 fibers with different CFs, but for a very soft signal – 45 dBSPL. What happens to the shapes of FR curves at higher sound levels? Shown here are FR curves – measured at the 8th N – for a single fiber (CF=1700 Hz) at 8 different signal intensities from 25-95 dBSPL. How do the shapes of these “bandpass” filters change with increases in sound level? (from Rose et al., 1971) Frequency response curves for a single auditory nerve fiber (CF=1700 Hz) at eight different signal intensities. Note that the frequency response curves are relatively narrow at low presentation levels but become very broad at higher intensities. Data from Rose et al. (1971).
Synchrony Coding (simplified version): The period of the 8th pulse train matches the period of the original signal; e.g., if the signal has a period of 100 Hz, the most common inter-spike interval on the 8th N will be 10 ms. High frequency = short interspike interval, low frequency = long interspike interval. What could be more straightforward? So: (a) if the signal period is 10 ms (100 Hz), the most common interspike interval will be 10 ms; (b) if the signal period is 5 ms (200 Hz), the most common interspike interval will be 5 ms; (c) if the signal period is 1 ms (1000 Hz), the most common interspike interval will be 1 ms; (d) if the signal period is 0.5 ms (2000 Hz), the most common interspike interval will be 0.5 ms. Right? What’s wrong with this? Can the interspike interval be 0.5 ms?
Volley Theory (an elaboration of Synchrony Coding) Basic idea is pretty straightforward: Because of refractory intervals, no individual fiber can fire with a period equal to that of the input signal. Individual fibers catch a cycle, miss one or more, catch another one, miss a few, etc. The period of the input signal is not preserved on any individual fiber, but it is reflected in the most common interspike interval of a population of fibers.
Another view of the Volley Principle Both of these pictures of volley theory are oversimplified since they show the neuron always firing at the time when the signal amplitude reaches a peak. This is not the case since the entire hair cell-nerve fiber relationship is probabilistic rather than deterministic. The point of maximum amplitude is the time when the probability of a pulse is greatest (though not guaranteed). However, if the fiber is most likely to fire at the amplitude peak, the most common interspike interval (of a population of fibers) will equal the period of the input signal.
Thought Experiment Cochlea is unrolled and the auditory nerve is exposed. Patient is awake and able to tell us what he hears. We have a stimulating electrode and can deliver any pattern of electrical current at any rate to any of these nerve fibers – alone or in combination. According to place theory, how would we artificially induce a sensation of high pitch; i.e., fool the listener into thinking he’d heard a high frequency sound? How about low pitch? According to synchrony theory, how would we artificially induce a sensation of high pitch; i.e., fool the listener into thinking he’d heard a high frequency sound? How about low pitch? cochlear branch of 8th N: ~30,000 fibers to brainstem
Place Theory and Synchrony Theory So, we have a Place or TonotopicCode: Frequency is coded by the place along the BM where 8th N electrical activity is greatest (base=high freq; apex=low freq, etc.) We also have a Synchrony Code (with the Volley Principle tacked on to make it work even with the limits imposed by refractory intervals) based on the timing of 8th N pulses: Frequency is coded by the interspike interval of a population of fibers (short interspike interval=high freq; long interspike interval=low freq). Is one of these theories right and the other one wrong? Probably not. Commonly Held View ~15 to ~400 Hz: Mainly synchrony ~400 to ~4000-5000: Combination of place and synchrony above ~4000-5000: Only place
Poisson Coding on the Auditory Nerve From Rose et al., 1971
Youtube video http://www.youtube.com/watch?v=PeTriGTENoc (Search Youtube for “auditory transduction”)