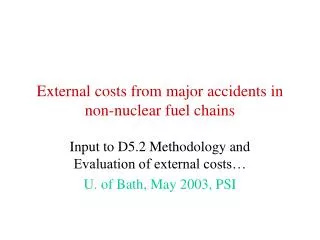
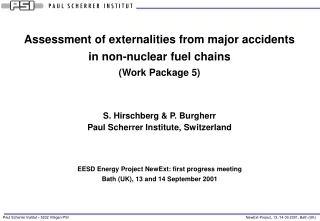
Assessment of externalities from major accidents in non-nuclear fuel chains ( Work Package 5)
Assessment of externalities from major accidents in non-nuclear fuel chains ( Work Package 5). Stefan Hirschberg & Peter Burgherr Paul Scherrer Institute, Switzerland Alistair Hunt, University of Bath. EESD Energy Project NewExt: Mid-term Assessment Meeting

Assessment of externalities from major accidents in non-nuclear fuel chains ( Work Package 5)
E N D
Presentation Transcript
Assessment of externalities from major accidentsin non-nuclear fuel chains(Work Package 5) Stefan Hirschberg & Peter Burgherr Paul Scherrer Institute, Switzerland Alistair Hunt, University of Bath EESD Energy Project NewExt: Mid-term Assessment Meeting Villigen/Würenlingen, 26/27 May 2003
Content • Work Performed • Final Database and Selected Energy Chain-Specific Results • Aggregated Indicators and External Costs • Impacts • Valuation • Estimated Damage Costs • Remaining (Valuation) Issues • Conclusions
Progress since Paris meeting (Oct 2002) • Full implementation of database extension to the end of year 2000 • Evaluations based on extended database • Resolution of valuation issues • Report in progress
Resolved issues • Separation of occupational and public accidents • Value of statistical life to be used for estimation of accident-related external costs • Allocation of accidents (some sensitivities examined) • Importance of smaller accidents (addressed to extent feasible in view of reporting completeness) • Evaluation of trends (some indications) • Probabilistic analysis for hydropower (concept and example results) • Economic valuation (awaiting final results of WP 2; degree of internalization established)
Severe accident definition(as used in ENSAD) • One or several of the following consequences: • At least 5 fatalities • At least 10 injured • At least 200 evacuees • Extensive ban on consumption of food • Release of hydrocarbons exceeding 10‘000tonnes • Enforced clean-up of land and water over an area ofat least 25km2 • Economic loss of at least 5 million USD
Overview of accidents by type A: No consequence threshold B: C or D or E or H C: at least 5 fatalities D: at least 10 injured E: at least 200 evacuees H: at least 5 Mio USD (2000) of economic loss
Severe accidents with at least 5 fatalities • First line: Coal non-OECD w/o China; second line: Coal China • Banqiao and Shimantan dam failures together caused 26000 fatalities
Actual vs. reported accidents • There is a discrepancy between the number of accidents that actually occur and those that are published. • The relatively rare major accidents have a much greater probability of being publicised than the much more frequent accidents that cause less severe damage or danger.
Smaller accidents in coal mining in the USA (1995-2001) * * Including one large accident with 13 fatalities Analysis based on MSHA statistics
Coal chain – number of severe accidents OECD vs. non-OECD w/o China
Coal Chain – number of fatalities in severe accidents OECD vs. non-OECD w/o China
Number of fatalities in severe accidentsby coal chain stages (1969-2000)
Coal Chain – number of fatalities in severe accidents in China
Oil Chain – number of severe accidents OECD vs. non-OECD
Oil Chain – number of fatalities in severe accidents OECD vs. non-OECD
Number of fatalities in severe accidentsby oil chain stages (1969-2000)
Input of oil to the sea Source: modified from Committee on Oil in the Sea, 2003
Oil spills facts (1969-2000) • 118 offshore and 38 onshore oil spills >10’000 tonnes between 1969 and 2000. • The biggest spill ever occurred during Gulf War II in 1991 when between 768’000 and 1’472’000 tonnes spilled from oil terminals and tankers. • The second biggest spill occurred over a ten-month period (June 1979 - February 1980) when 480’000 tonnes spilled at the Ixtoc I well blowout in the Gulf of Mexico near Ciudad del Carmen, Mexico. • In comparison, the largest tanker spill had a size of about 290’000 tonnes (Sea Empress / Aegean Captain; 1979)
Oil spills facts (1969-2000) cont. • Overall, few very large spills were responsible for a high percentage of the total oil spilled in tanker accidents in the period 1969-2000. • But the magnitude of the impact is primarily depending on distance to the coast, weather and current conditions, whereas the amount and type of oil spilled may often be of secondary importance. • For example, the Exxon Valdez accident (Prince William Sound, Alaska, USA) in 1989 was relatively small with 37’000 tonnes oil lost, but it occurred close to the coastline and wind current moved the oil slick to the beaches leading to an ecological disaster.
Natural gas chain – number of severe accidents OECD vs. non-OECD
Natural gas chain – number of fatalities in severe accidents OECD vs. non-OECD
Number of fatalities in severe accidentsby natural gas chain stages (1969-2000)
LPG chain – number of severe accidents OECD vs. non-OECD
LPG chain – number of fatalities in severe accidents OECD vs. non-OECD
Number of fatalities in severe accidentsby LPG chain stages (1969-2000)
Number of severe accidents and aggregated rates (1969-2000) (*) second line: Banqiao/Shimantan accident with 26‘000 fatalities excluded
Severe accidents indicatorsOECD, EU-15 and non-OECD countries (no allocation)
Frequency-consequence curves for severe accidentsOECD, no allocation, 1969-2000
Frequency-consequence curves for severe accidentsEU-15, no allocation, 1969-2000
Frequency-consequence curves for severe accidentsnon-OECD, no allocation, 1969-2000
Frequency-consequence curves for severe accidentsCoal chain, no allocation, 1969-2000