Download

1 / 14
140 likes | 275 Views
Robust Optimization of Simulation models through Metamodels. Jack Kleijnen 1 , Gabriella Dellino 2 , Carlo Meloni 3 1 Tilburg University, 2 University of Siena, 3 Polytechnic of Bari Seminar presented at the Naval Postgraduate School , Monterey , June 2, 2010. Problem type.

E N D
RobustOptimization ofSimulationmodelsthrough Metamodels Jack Kleijnen 1, Gabriella Dellino 2, Carlo Meloni 3 1 Tilburg University, 2 University of Siena, 3 Polytechnic of Bari Seminar presented at theNaval Postgraduate School, Monterey, June 2, 2010
Problem type Central poblem:Design ‘optimal’ product or production system Solution: Simulation model of product or system Problem: Simulation requires much CPU time Solution: ‘Metamodel’ of simulation modelType 1: Polynomial regressionType 2: Kriging (Gaussian process)Note: Many more types (CART, MARS, NN, etc.) Problem: Decision versus environmental inputsEnvironment: Uncontrollable 2/17
Overview of seminar • Methodology for simulationoptimizationwithuncertaininputs(Static, deterministicmodels: Ben-Tal, Bertsimas) • Methodologyintegrates • Taguchi’s view: Decision & environmentalinputs • Design of experiments & metamodeling: RSM or Kriging • MathematicalProgramming: • Paretofrontier: ChangeT • Confidenceinterval: Bootstrap • Example: EconomicOrderQuantity (EOQ) • Future research 3/17
Taguchi’s worldview Decisionfactors: d(j) (with j = 1, …,k)Example: Q in EOQ model; wings in plane design Environmental factors: e(g) (with g = 1, …, c)Example: demand rate; pilot Track record in production engineering (Toyota) Critique: statisticians; see panel report Nair (1992) Real-life versus simulation experiments:Number of inputs, values, combinations: LHS Taguchi’s scalar loss function versus Pareto frontier
DOE & metamodel type I: RSM Box & Wilson (‘51): Classic optimization of real-life systemsTrack record: Myers, Montgomery, Anderson-Cook (2009) Myers et al.: Taguchianrobust optimization of real-life systems Myers et al.’s Taguchian metamodel: y = b0 + b’d +d’Bd + γ’e + d’Δe + ε (1)Optimize d; interaction between d & e Implications of (1):E(y) = b0 + b’d +d’Bd + γ’E(e) + d’ΔE(e) (2)var(y) = (γ’ + d’Δ)Ω(e)(γ + Δ’d) + var(ε) (3)Notes: (γ + Δ’d): gradient of y relative to e; see (1) If Δ = 0, then no control of var(y) through d; see (3)
DOE & metamodel type 2: Kriging Kriging: more flexible than polynomial regression (type 1) But: No implied var(y) (see preceding slide, eq. 3) Dellino, Kleijnen, Meloni (WSC 2009): estimate var(y) from crossed design with n1 combinations for d: space-filling design n2 combinations for e: LHS with distribution F(e) Fit Kriging models to & s(w) resp.: K1( |d) and K2(s(w)|d)
Kriging-variant for “expensive” simulation ‘Small’ deterministic (no F(e)) design D1 for d & eSimulation gives I/O data set (D1, w(D1)) Fit one Kriging metamodel: K(w|d, e) ‘Big’ design D2 for d & e with F(e)Kriging predictor ŷ of output w at each point in D2 Estimate E(ŷ|d2) and σ(ŷ|d2); see preceding slide, last two columns Fit two Kriging metamodels: K1(ŷ|d2) and K2(sŷ|d2)
Confidence intervals (CI):Parametric bootstrap RSM Remember: y = b0 + b’d +d’Bd + γ’e + d’Δe + ε (1)quadratic in d & e (optimize d; interaction d & e) Linear regression: y = ζ’ X + ε withζ’ = (b0, b’, vec B, γ’, vec Δ)’ and X = (…)OLS: ζ^ = (X’X)-1 X’w with simulation outputs wcov^ (ζ^) = (X’X)-1 s2(ε) with s2(ε) computed through MSRand fixed X (see next slide) Parametric bootstrap:Sample ζ* from N(ζ^, cov^(ζ^)) Re-estimate from ζ*: y* = ζ*’ X or y* = b*0 + b*’d +d’B*d + γ*’E(e) + d’Δ*E(e) (2*) Var*(y) = (γ*’ + d’Δ*)Ω(e)(γ* + Δ*’d) + s2(ε) (3*) Bootstrap sample size: repeat B (= 100) times 90% CI: rank B predictions y*(b) with b = 1, …, B take 5% & 95% quantilesAnalogously for var*(y) Result: CI with too low coverage 8/17
Confidence intervals:Distribution-free bootstrap Kriging Remember table: Resample n_e columns (nd–dimensional outputw: CRN):Result: nd x ne matrix W* Compute per row: average and standard deviation Fit Kriging models for averages resp. standard deviations Result: CI with good coverage for both Kriging variants. 9/17
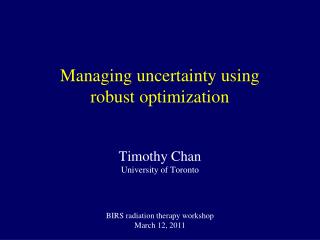
Example: EOQ with uncertain demand rate 4 x 10 8.9 8700 Approach 1 Approach 1 Approach 2 Approach 2 8.88 8600 Analytic Model Analytic Model 8.86 8500 8.84 8400 8.82 sC C 8300 8.8 8200 8.78 8100 8.76 8000 8.74 1.5 2 2.5 3 3.5 4 4.5 1.5 2 2.5 3 3.5 4 4.5 Q Q 4 4 x 10 x 10 10/17
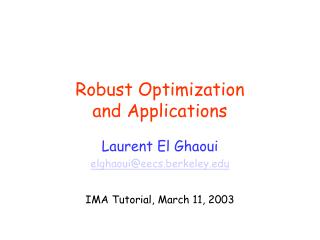
Bootstrapping of metamodels 4 x 10 8.9 8700 Approach 1 Approach 1 4 x 10 Approach 2 Approach 2 8.88 8600 9.2 12000 Analytic Model Analytic Model Approach 1 Approach 1 9.1 8.86 Approach 2 Approach 2 11000 8500 Analytic Model Analytic Model 9 8.84 10000 8400 8.9 8.82 sC C 8.8 9000 8300 8.8 8.7 sC C 8000 8200 8.6 8.78 8.5 7000 8100 8.76 8.4 6000 8000 8.74 1.5 2 2.5 3 3.5 4 4.5 1.5 2 2.5 3 3.5 4 4.5 8.3 Q Q 4 4 x 10 x 10 8.2 5000 1.5 2 2.5 3 3.5 4 4.5 1.5 2 2.5 3 3.5 4 4.5 Q Q 4 4 x 10 x 10 11/17
Pareto frontier 4 x 10 8.92 Approach 1 8.9 Approach 2 Analytic Model 8.88 8.86 8.84 C 8.82 8.8 8.78 8.76 8.74 8180 8200 8220 8240 8260 8280 8300 8320 8340 8360 8380 sC Risk-averse management: low threshold T for s(c) (see x-axis)Result: high expected cost (see y-axis) Corresponding Q (see preceding slide) may give higher s(w) (see bootstrap CI) Reconsider Pareto choice? Lower T (higher Q)? Etc.Or use quantile?? Ongoing research! 12/17
Example: EOQ with uncertain demand rate and costs Add: Uncertain holding cost and set-up cost RSM metamodel: CI do not cover true mean and standard deviation Two Kriging variants: CI based on order statistics cover true values; CI based on t-statistic narrowly miss true values 13/17
Future research • Relevant problem formulation: constrained s(w) or quantile q(w) or CVar? • RSM or Kriging variants? • Bootstrap: RSM assumes given X • Sample size for environmental variables • Discrete-event simulations: example (s, S)Aleatory uncertainty: Normal demand/dayEpistemic uncertainty: mean demand/day? • Multiple outputs: cost and service level • Split-plot instead of crossed design? 14/17