Value Stream Mapping for Process Optimization
Value Stream Mapping helps visualize value creation and waste elimination in product family. Identify material and information flow to improve Lean practices. Features present state map with customer demand analysis, process definition, and lead time calculations. Strategies for improvement include producing to Takt Time and load-leveling production.

Value Stream Mapping for Process Optimization
E N D
Presentation Transcript
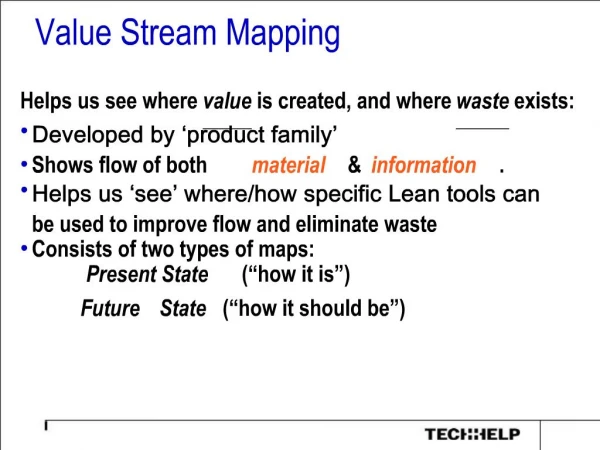
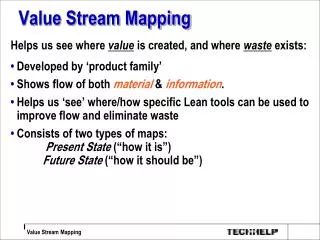
Value Stream Mapping Helps us see where value is created, and where waste exists: • Developed by ‘product family’ • Shows flow of both material & information. • Helps us ‘see’ where/how specific Lean tools can be used to improve flow and eliminate waste • Consists of two types of maps:Present State (“how it is”)Future State (“how it should be”)
Map Features 1: DOCUMENT CUSTOMER DEMAND 2: DEFINE PROCESSES w/OPERATION DATA 3: SHOW MATERIAL FLOW 4: SHOW INFORMATION FLOW 5: COMPUTE LEAD TIMES
Process Data Boxes • Cycle time: Observed & Effective • Changeover time & frequency • % Availability to Demand • Number of operators • % Quality level (first-pass yield) • Batch size
Questions – Part 1 • Are there any symbols on the map that you don’t recognize? • What determines the work schedule at each station? • How is ‘time’ data in the map acquired? • What is the bottleneck in the ACME manufacturing process? • Where is the biggest changeover time? What does this mean for downstream processes?
Questions – Part 2 • What is the manufacturing lead time for a product (definition and value)? How does that compare to the value added time? • What is the impact of 1 truck a day leaving with finished goods and trucks arriving on Tuesday and Thursday with coils of steel?
Questions – Part 3 • Where do you see waste in this process and what types of waste from the mnemonic CLOSED MITT do you see? • What countermeasures could be taken to reduce the most significant forms of waste?
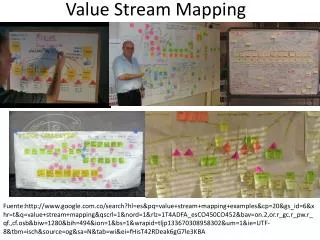
Mapping Methodology • Focus on a product family within single plant. • Seek leadership from the value stream manager. • Go and see. Conduct door-to-door process walk. • Work backwards, starting at the shipping door. • Capture and quantify basic operations involved. • Encourage participation of all stakeholders. • Use pencil & paper rather than CAD.
Investigation Etiquette • Get management approval • Communicate to all areas before visit • Make introductions when you get there • Remember, the workers are the experts for their tasks! • Respect people’s work space • Explain your purpose
Strategies for Process Improvement #1: Produce to your Takt Time. #2: Develop continuous flow where possible to reduce inventory. Eliminate isolated islands of production. #3: Use supermarkets to control production where continuous flow does not extend upstream (often outside the plant). #4: Try to send customer schedule to only one production process (pacemaker). #5: Load-level production at pacemaker. #6: Release/withdraw small, consistent increments of work to pacemaker (pitch).
Establish Takt Time Takt Time = Demand Rate Work Time Available Takt Time= Number of Units Sold 900 Seconds 85 Boards = 10.6 Sec/Board Takt Time = Cycle Time Takt Time = Minimum # of People GOAL: Produce to Demand
Questions – Part 4 • What is the company’s Takt time if the demand is 460 parts per 8 hour shift (with two 10 minute breaks)? • Where is it not practical to achieve continuous flow? How could a supermarket be used to overcome this? • How can the welding and assembly operations be configured to Takt time? • What should be the pacemaker process? • What other improvements are possible?