Download

1 / 11
110 likes | 257 Views
MWCOG – The Solar Advantage. Todd Foley Director, Business Development BP Solar. BP Commitment to Solar. Large Solar Manufacturer & Marketer ($300 Million in Revenues; product in 160 countries) 18%Market Share

E N D
MWCOG – The Solar Advantage Todd Foley Director, Business Development BP Solar
BP Commitment to Solar • Large Solar Manufacturer & Marketer ($300 Million in Revenues; product in 160 countries) • 18%Market Share • Largest User of Solar Power-6 Mega Watts Deployed on 380 Service Stations & Other Structures • Solar is Core of Alternatives Strategy with Wind, Fuel Cells & Hydrogen - $500 million invested ’01-’03 • Local: HQ in Frederick
Peak Power Shaver (not base load) Distributed Power Source - Power at Point of Demand Enhances Energy Security & Reliability – no maintenance or fueling Infinitely Scaleable Aesthetically Pleasing Zero Emissions – offsets emissions from conventional sources Jobs! 36 for every MW installed CA today: 4000+ jobs 450+ companies Solar Power = High-Value Electricity PV Output Demand 00:00 12:00 24:00
PV Market Growth/Drivers • 34% Market Growth in 2003 • 574 Mega Watts in 2003 • Rising Electricity Costs & Growing Demand: 45% in next 20 years • Fuel Diversity – Price Hedge • T&D Constraints • Cost Reduction: 5% p.a. • Overcoming Regulatory Hurdles • Incentives • Simple & Uniform Net Metering/Interconnection Standards • Environmental Impact of Energy Use • Consumer/Voter Popularity: 91% polled by USA Today Prefer Solar Power to Other Sources
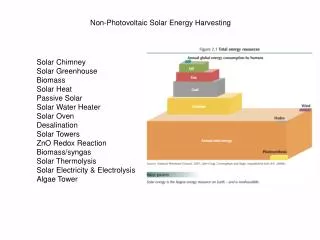
Solar Applications • Homes • Buildings+EE: • Commercial • Public/Schools, etc. • Remote/Off-Grid Needs: • Signage • Parks
Issues for Continued Growth • Commitment/Leadership • Level Playing Field: • Simple & Uniform Net Metering & Interconnection Standards • $$$ Value for “External” Benefits • Codes/Covenants • Funding/Incentives: • RPS • Public Benefits Charges/Rebates • Tax Credits • Awareness: utilities, consumers
Local/State Leaders • California • LADWP • SFPUC • SMUD • San Diego • Chicago • New Jersey • New York • Arizona • Nevada
Chicago Washington, DC New York